Variables
Data is the foundation of any model, and it is stored in containers called Variables. Serving as the primary vessels for data, variables are used universally across both input and output. Each variable encompasses three essential pieces of information: variable name, data type, and data shape.
NumPy's ndarray. For non-scalar data, this means it is organized into an array with a defined shape. For example, a shape of [2,3] indicates that the data consists of 2 rows, each with 3 columns.Variable Display
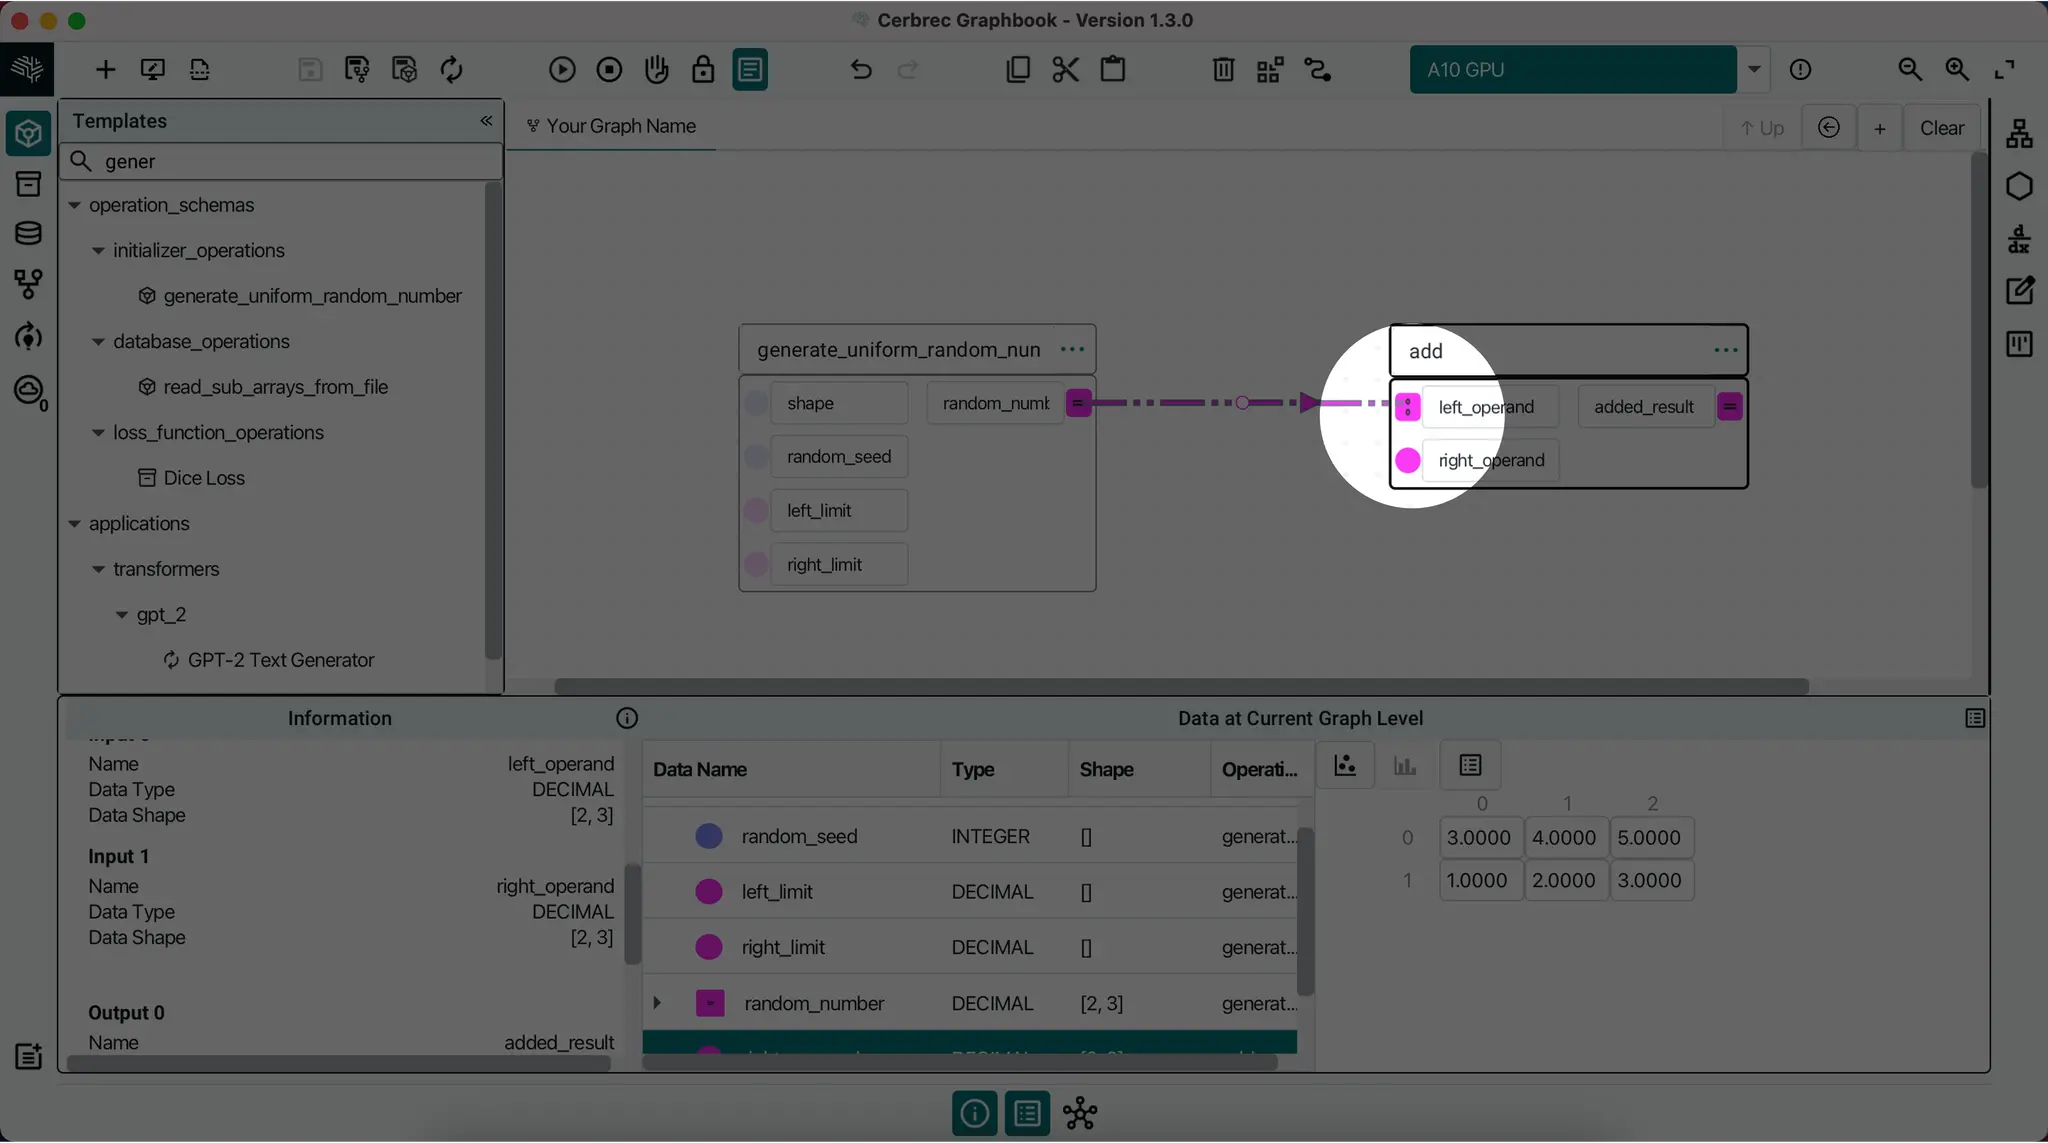
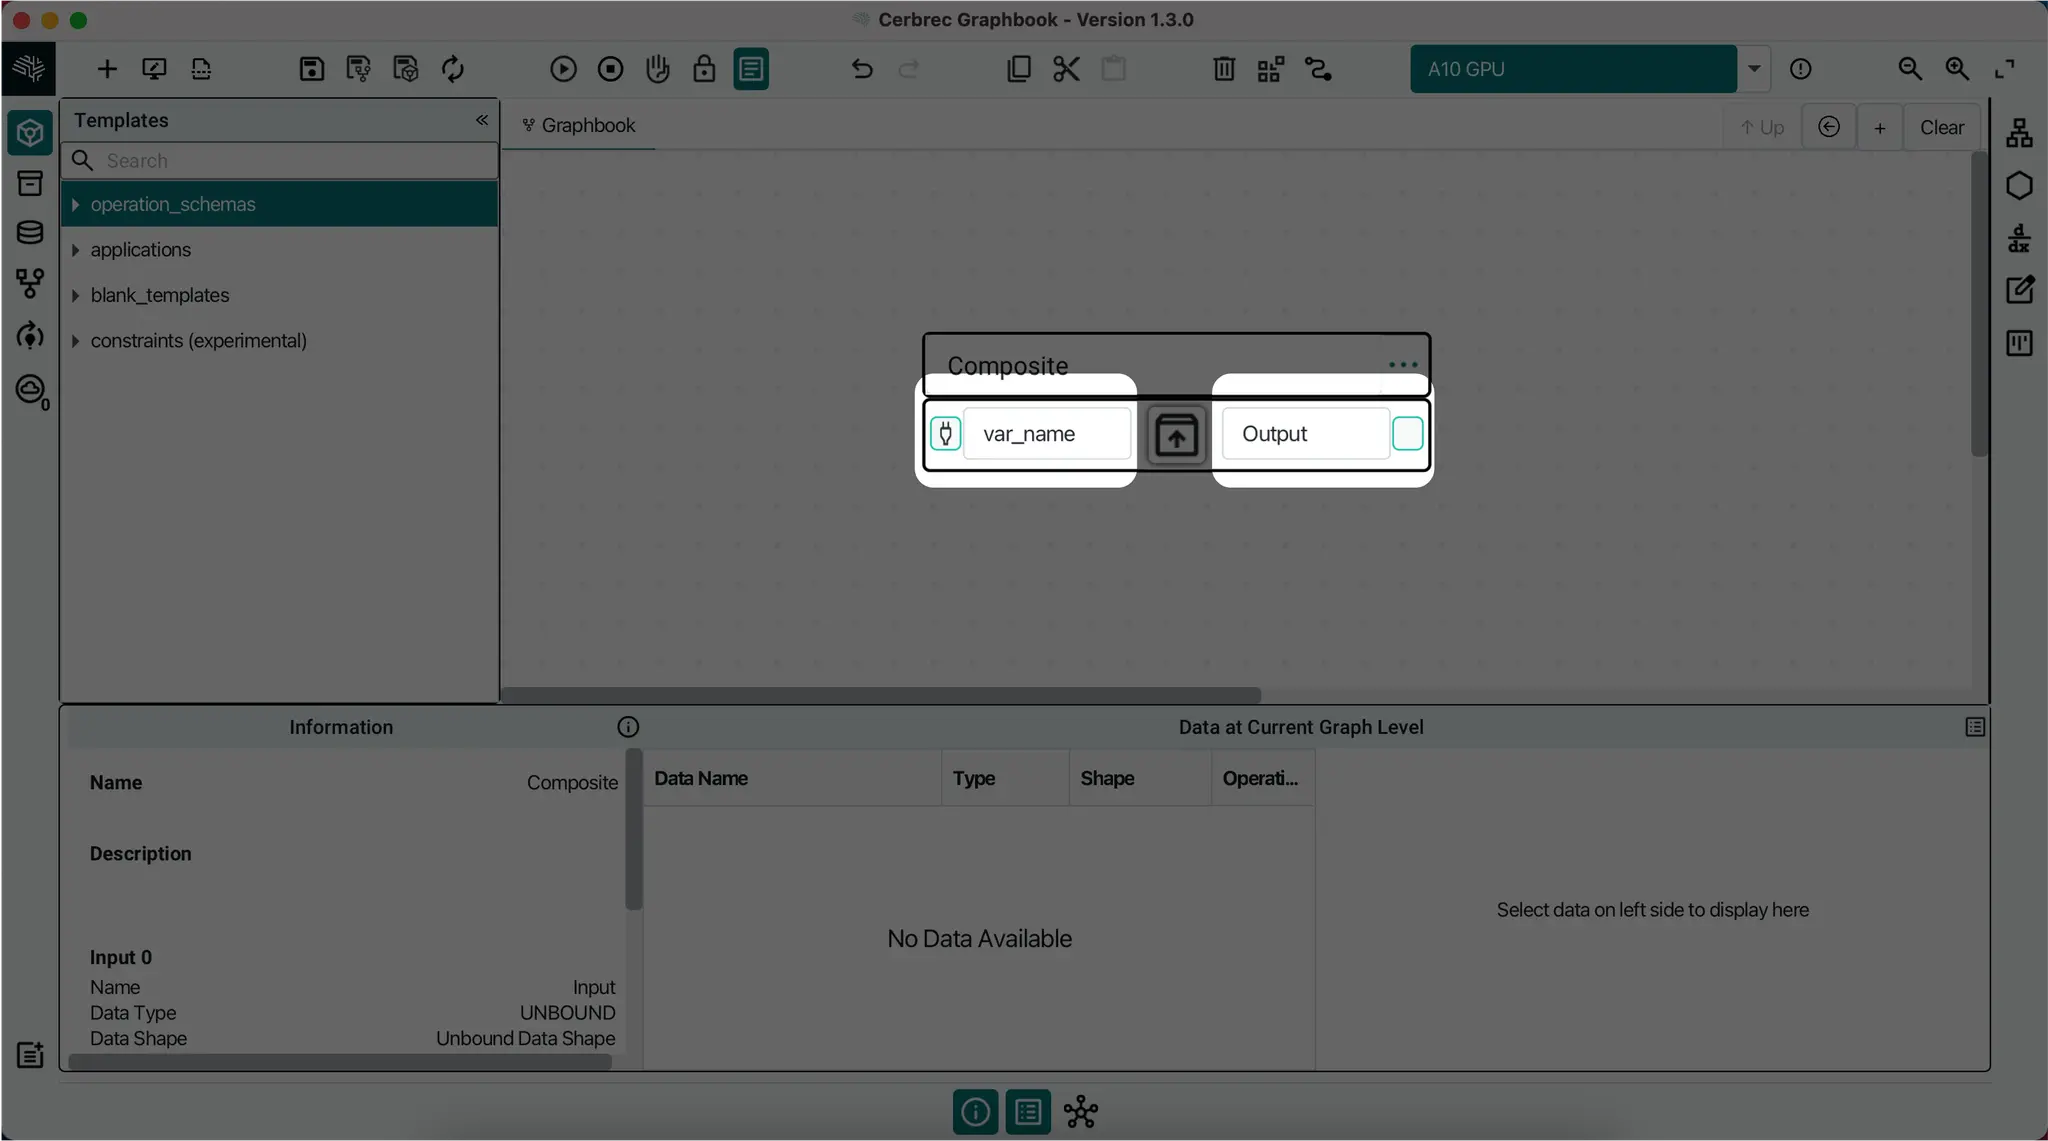
Graphbook variables are visually represented as rectangles with two parts, a text label with its name, and a box or slot with a colored outline. Data will generally be displayed as going from left to right, so input variables appear on the left, and output variables on the right.
Assign Data to a Variable
Graphbook allows you to manually bootstrap static data or input data by drawing links between variables.
Linking Data
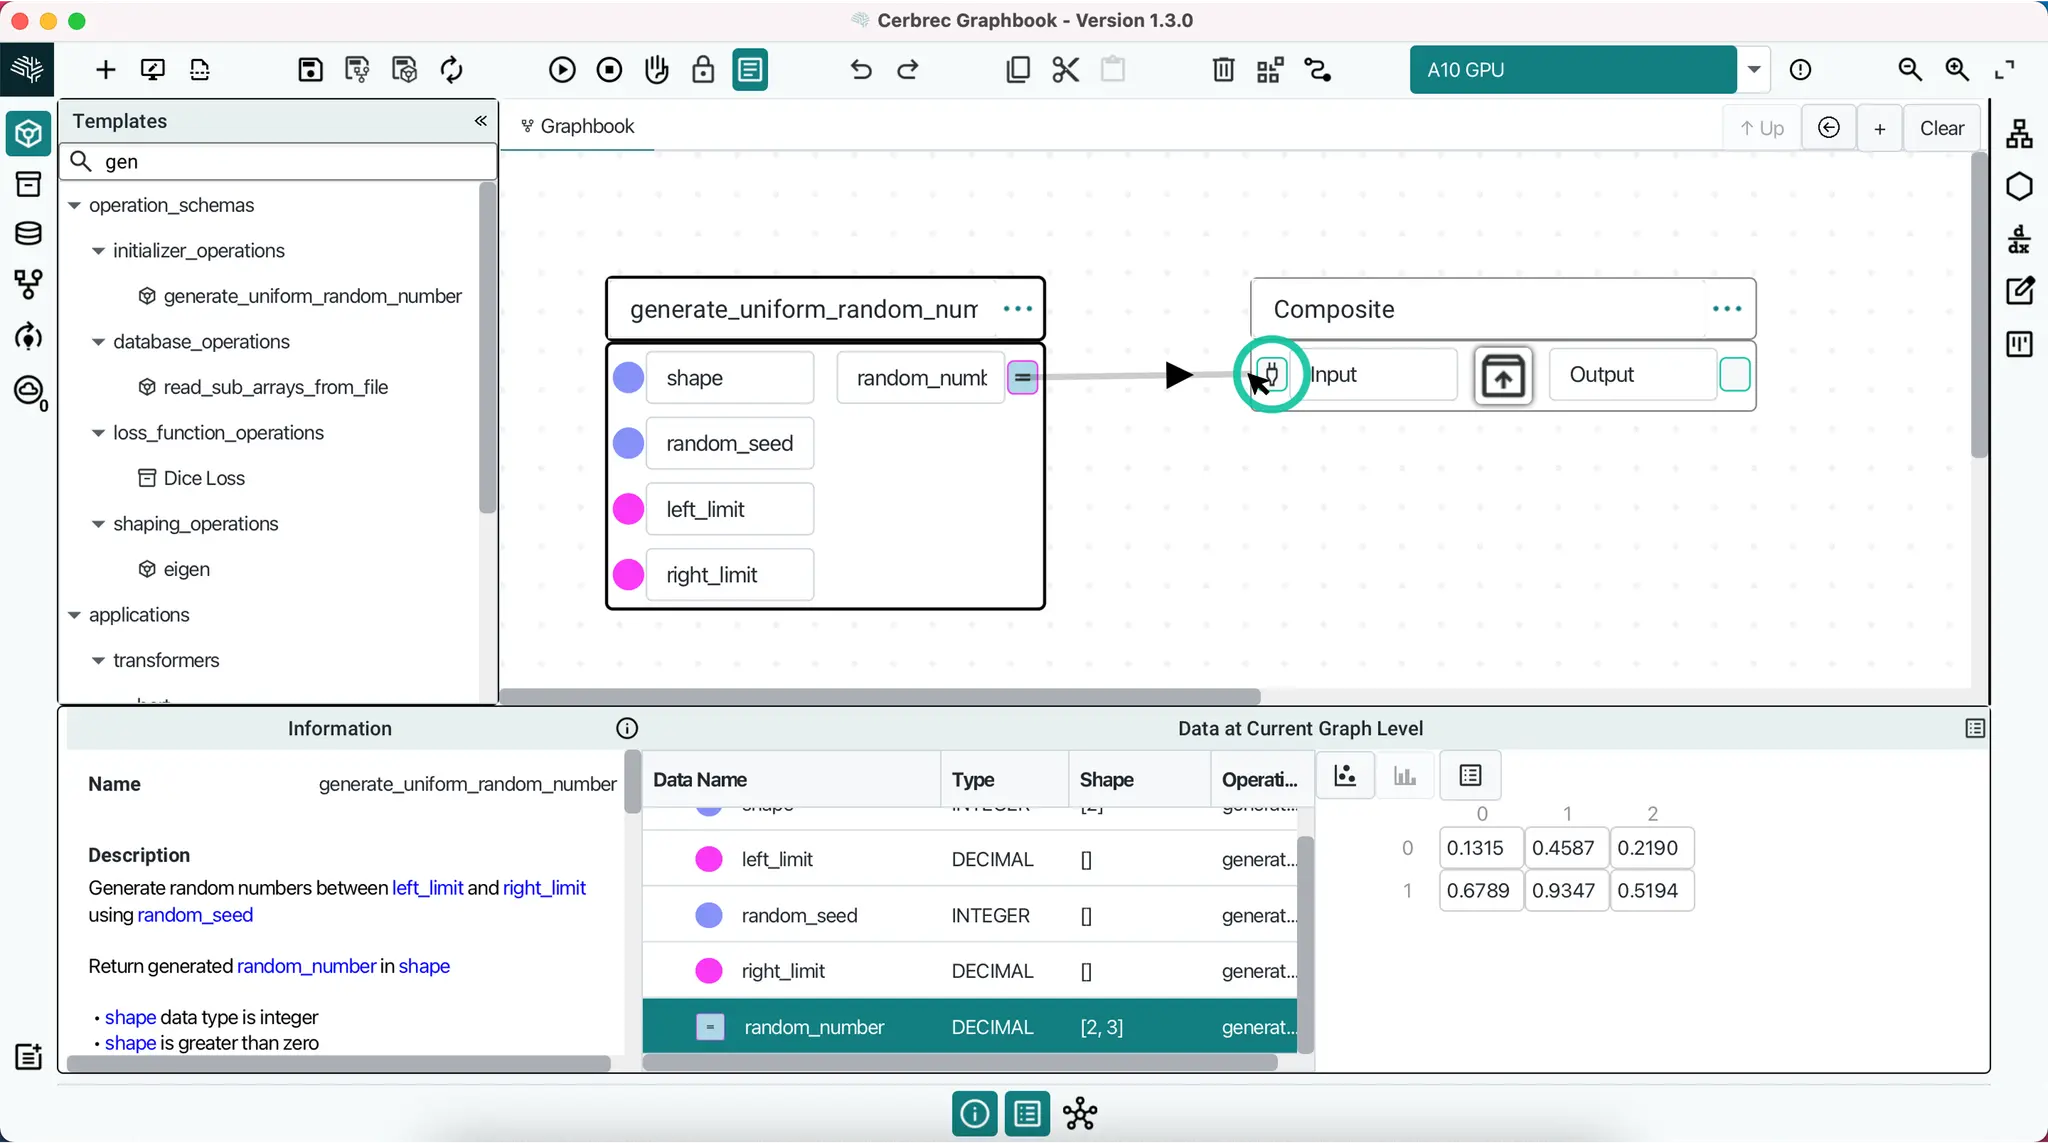
When your mouse approaches a variable's slot, a circle will appear around it. This indicates that this variable is focused. You can single-click on the slot or use the Space Bar to start setting up data links between variables.
Bootstrap Data
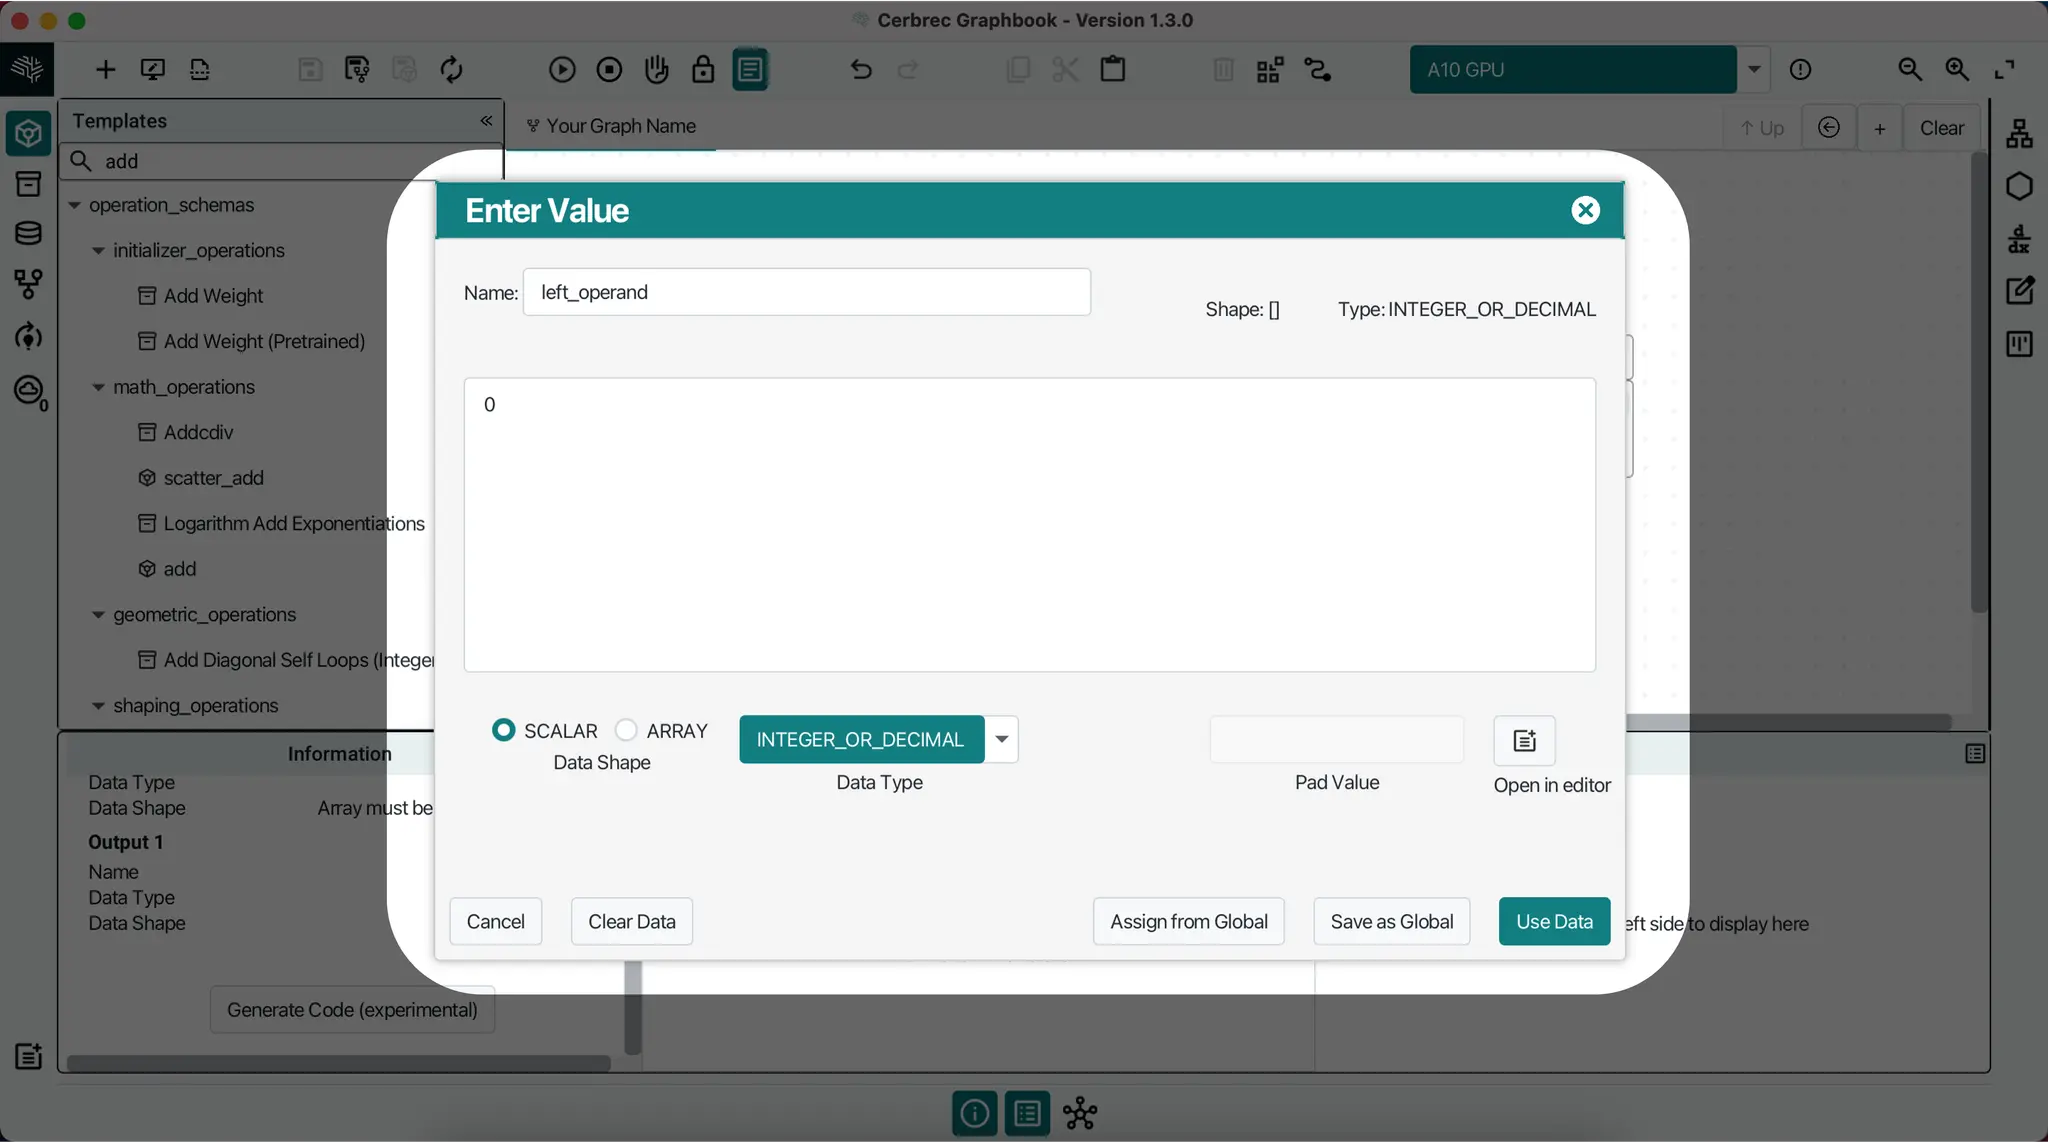
To manually input data, hover over the variable you want to edit. Once the circle appears around it, you can double-click on the slot or use Shift + Space to open the Enter Value window and manually input the data.
Enter Value
Overview
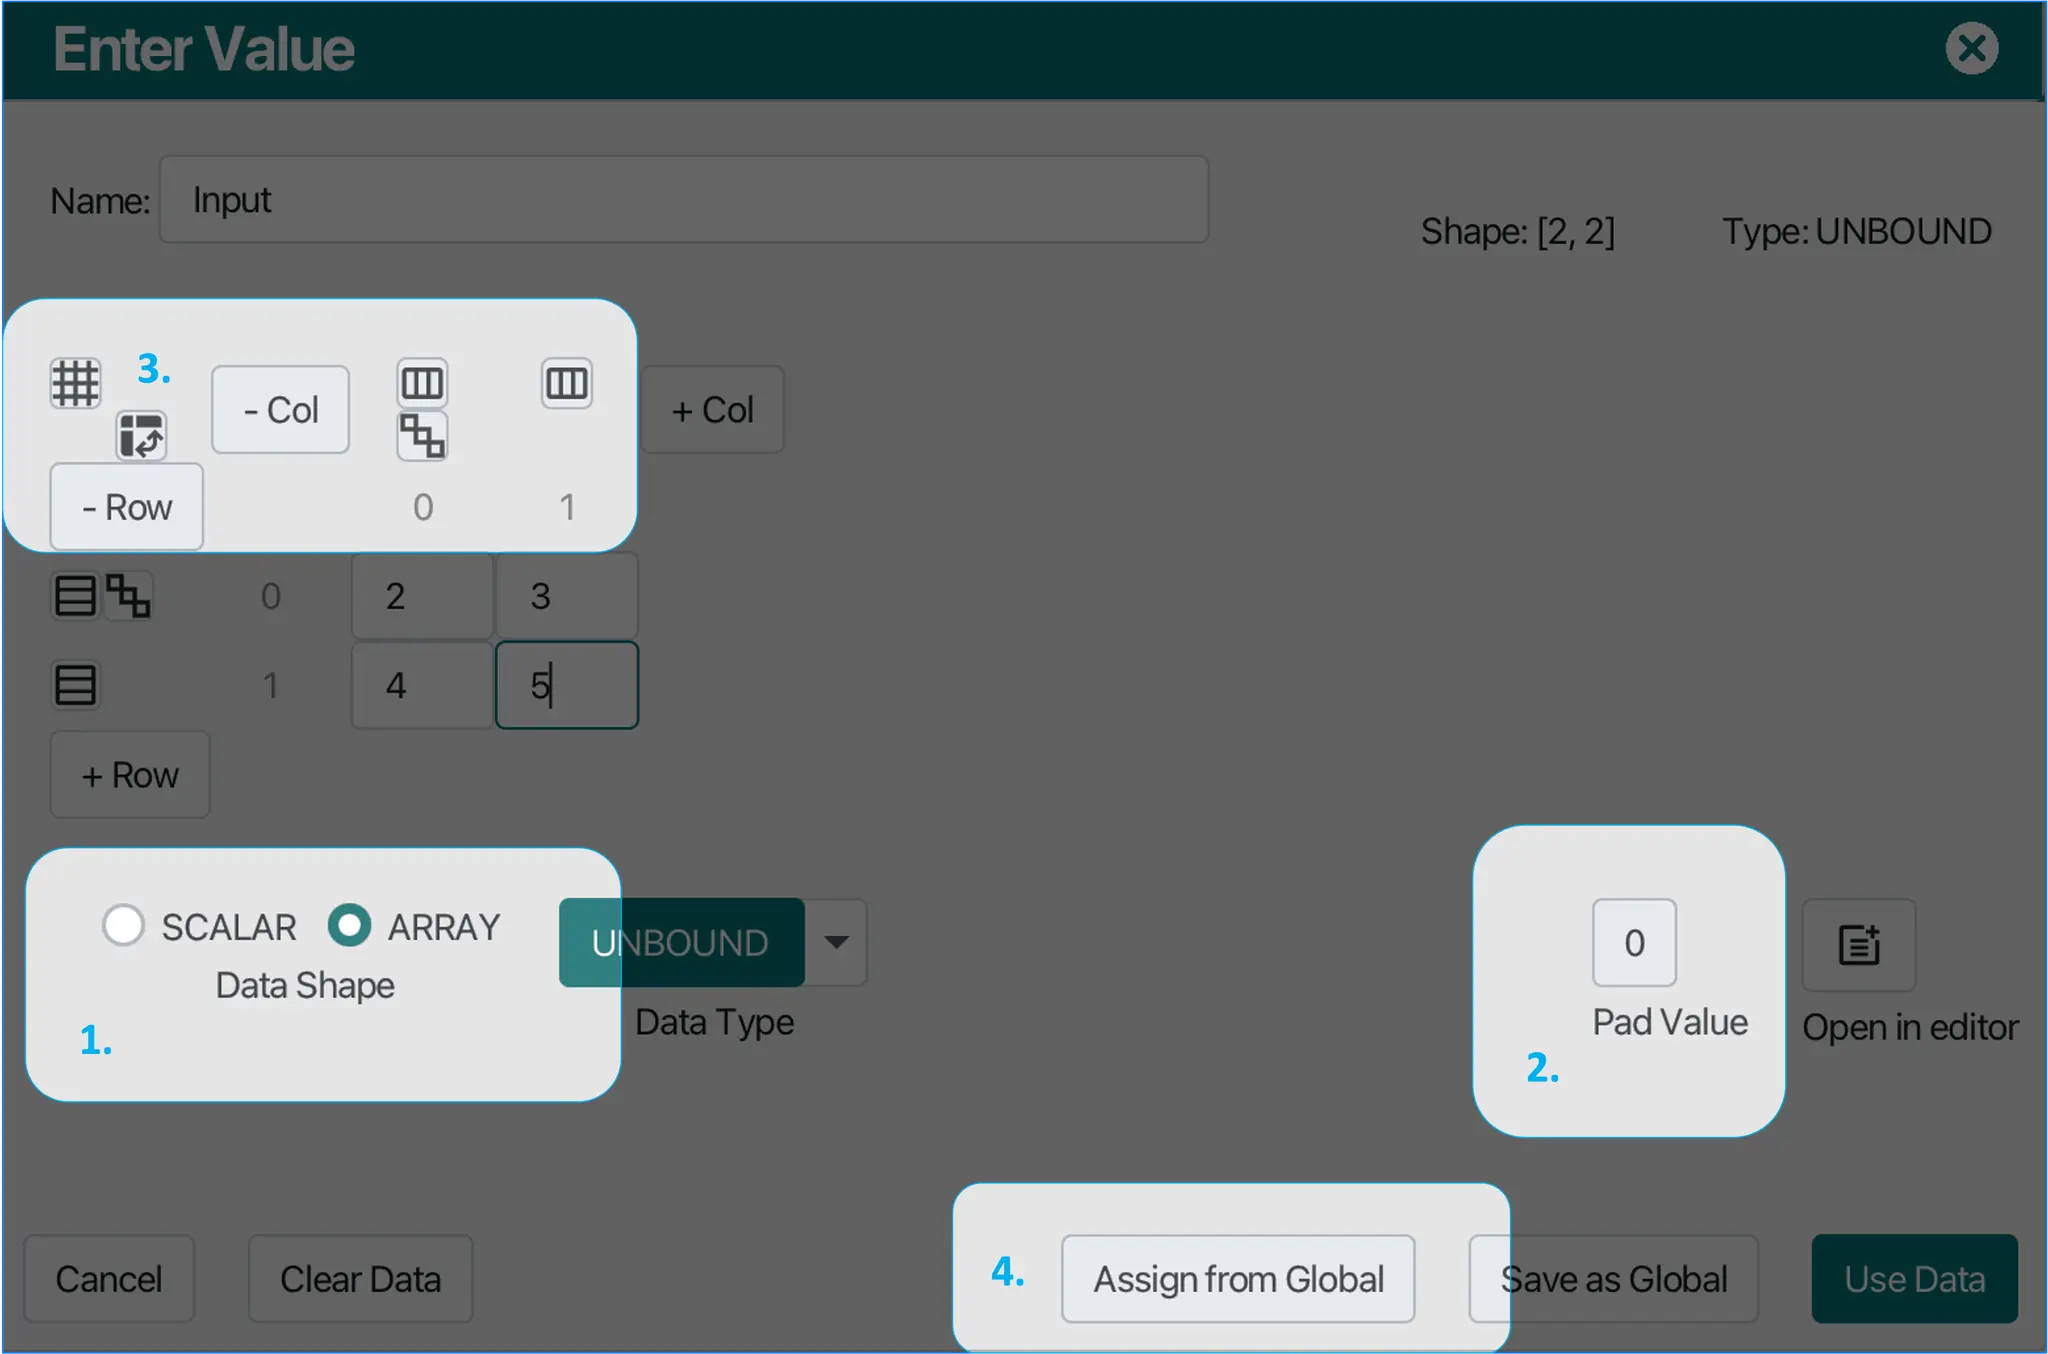
When you open the Enter Value window, you'll see three key details about the variable at the top:
- Name: The identifier for the variable.
- Type: The data type, including
INTEGER,DECIMAL,BOOLEAN, andTEXT. - Shape: The dimensionality of the data, such as:
- Scalar (no array):
[ ] - 1-dimensional array:
[𝑥] - 2-dimensional array:
[𝑥,𝑦] - And more...
- Scalar (no array):
Working with Array Data
Switch from SCALAR to ARRAY type to add rows and columns, and use padding tools to assign values. You can transpose data or use icons to assign values quickly. You can also use the Assign from Global tool to use global constants as data.
Saving and Submitting Data
Once you've input your data, you can either submit it or save it as a global constant. Learn more about Global Constants here.
Data Representation
Bootstrapped (static) data is represented by a circle in the slot. Other variables will automatically update to reflect their required data shape and type. View the full data representation guide here.