Report Generation & Editor Documentation
The Report Generation feature in Graphbook Intelligence Platform allows you to create, manage, and customize comprehensive reports using AI-powered agents. From the user portal, you can access all report generation capabilities including creating new reports, editing existing ones, and managing report layouts.
Accessing Report Generation
When you first log in, you will see the user portal landing page. To access the report generation features, navigate to /u/report-generation or click on Report Generation from the main navigation.

Report Generation Dashboard
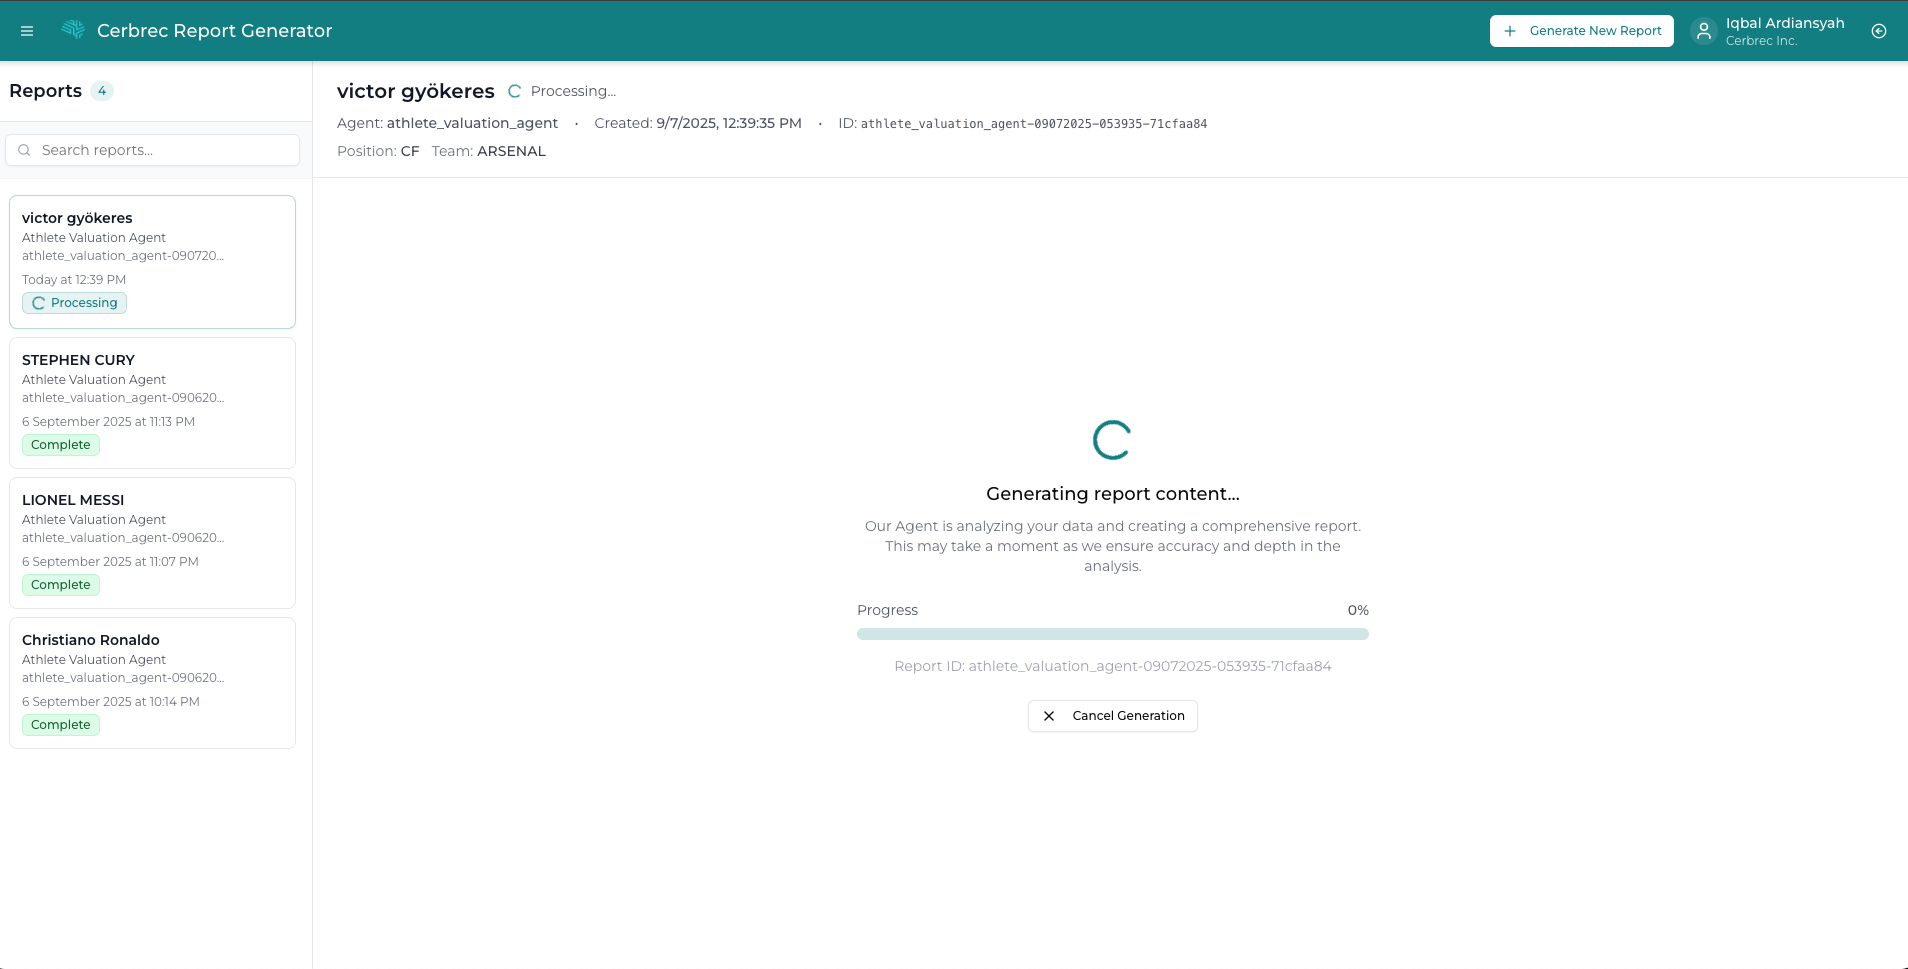
The Report Generation page provides a comprehensive view of all your reports. The dashboard displays all reports you've created, showing their current status including completed, running, or failed reports. On the left-hand side, you can see a list of all reports with their status indicators.
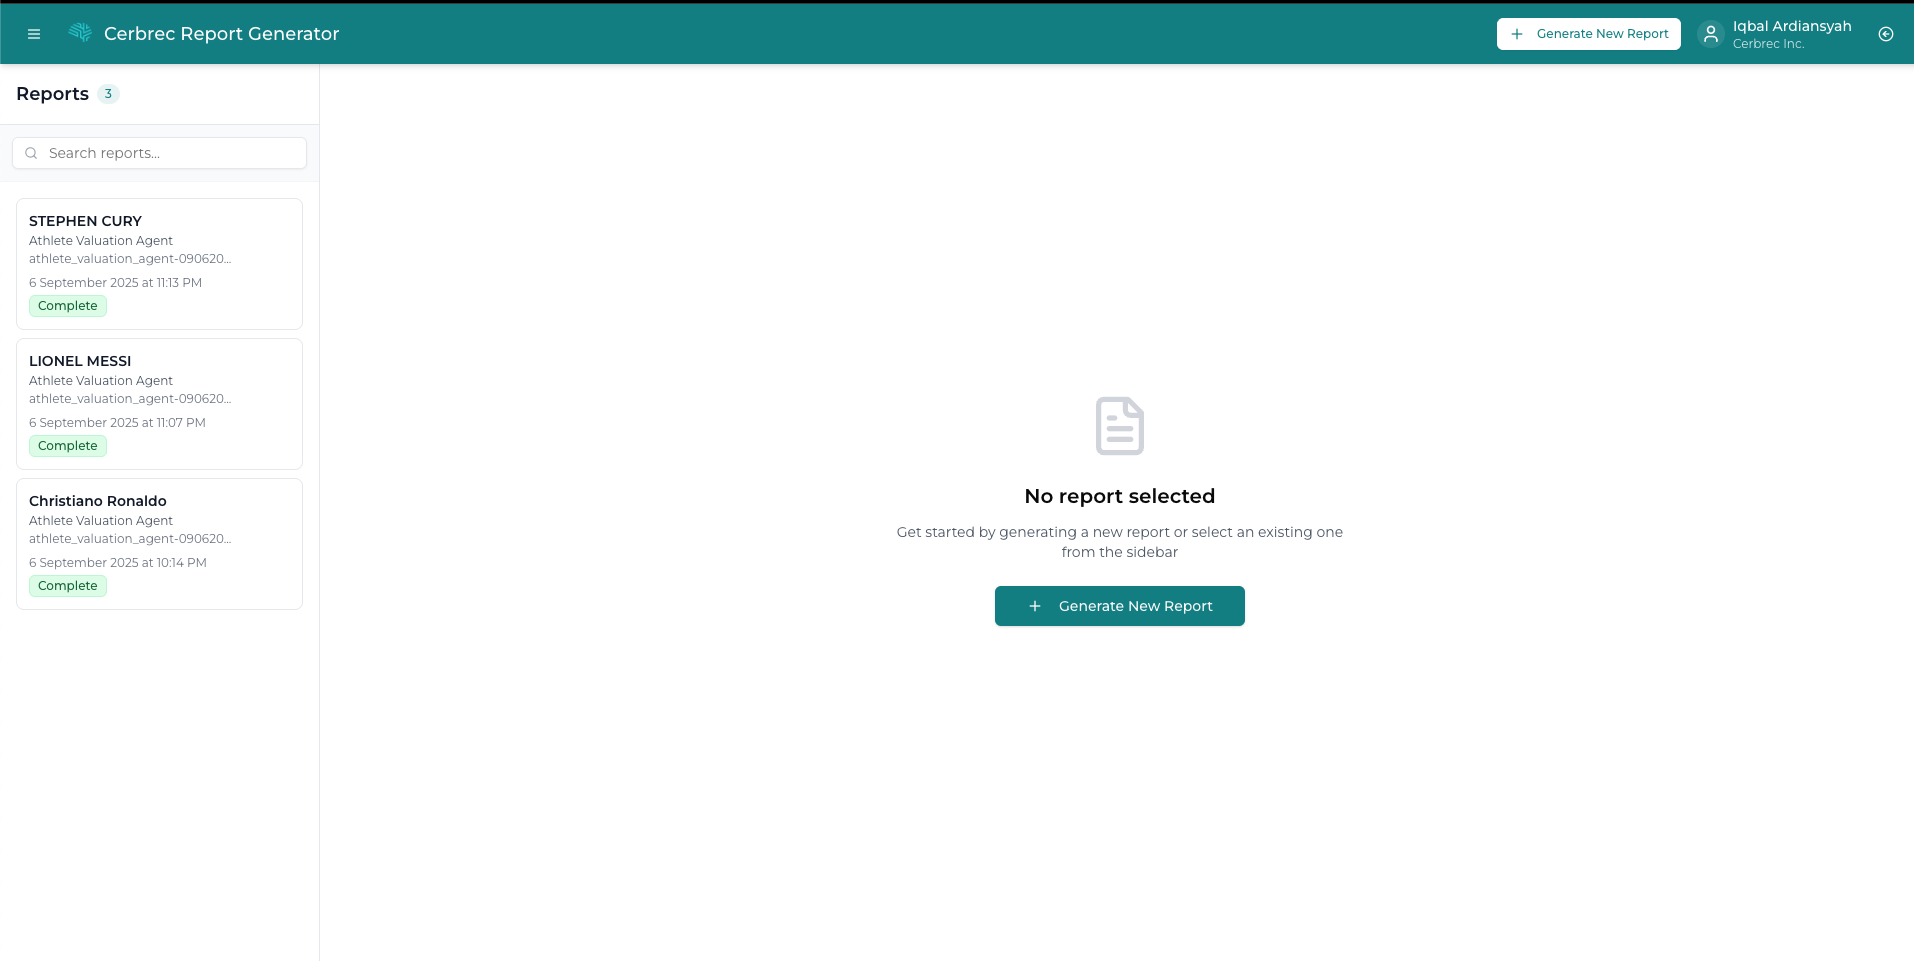
The dashboard consists of:
- Left Sidebar: List of all your reports with search and pagination
- Main Area: Selected report preview or welcome message
- Header: Organization name, user profile, and Generate Report button
Report Status Indicators
Reports display different status badges:
- Blue spinner: Currently generating
- Green badge: Complete
- Gray badge: Cancelled
- Red badge: Failed
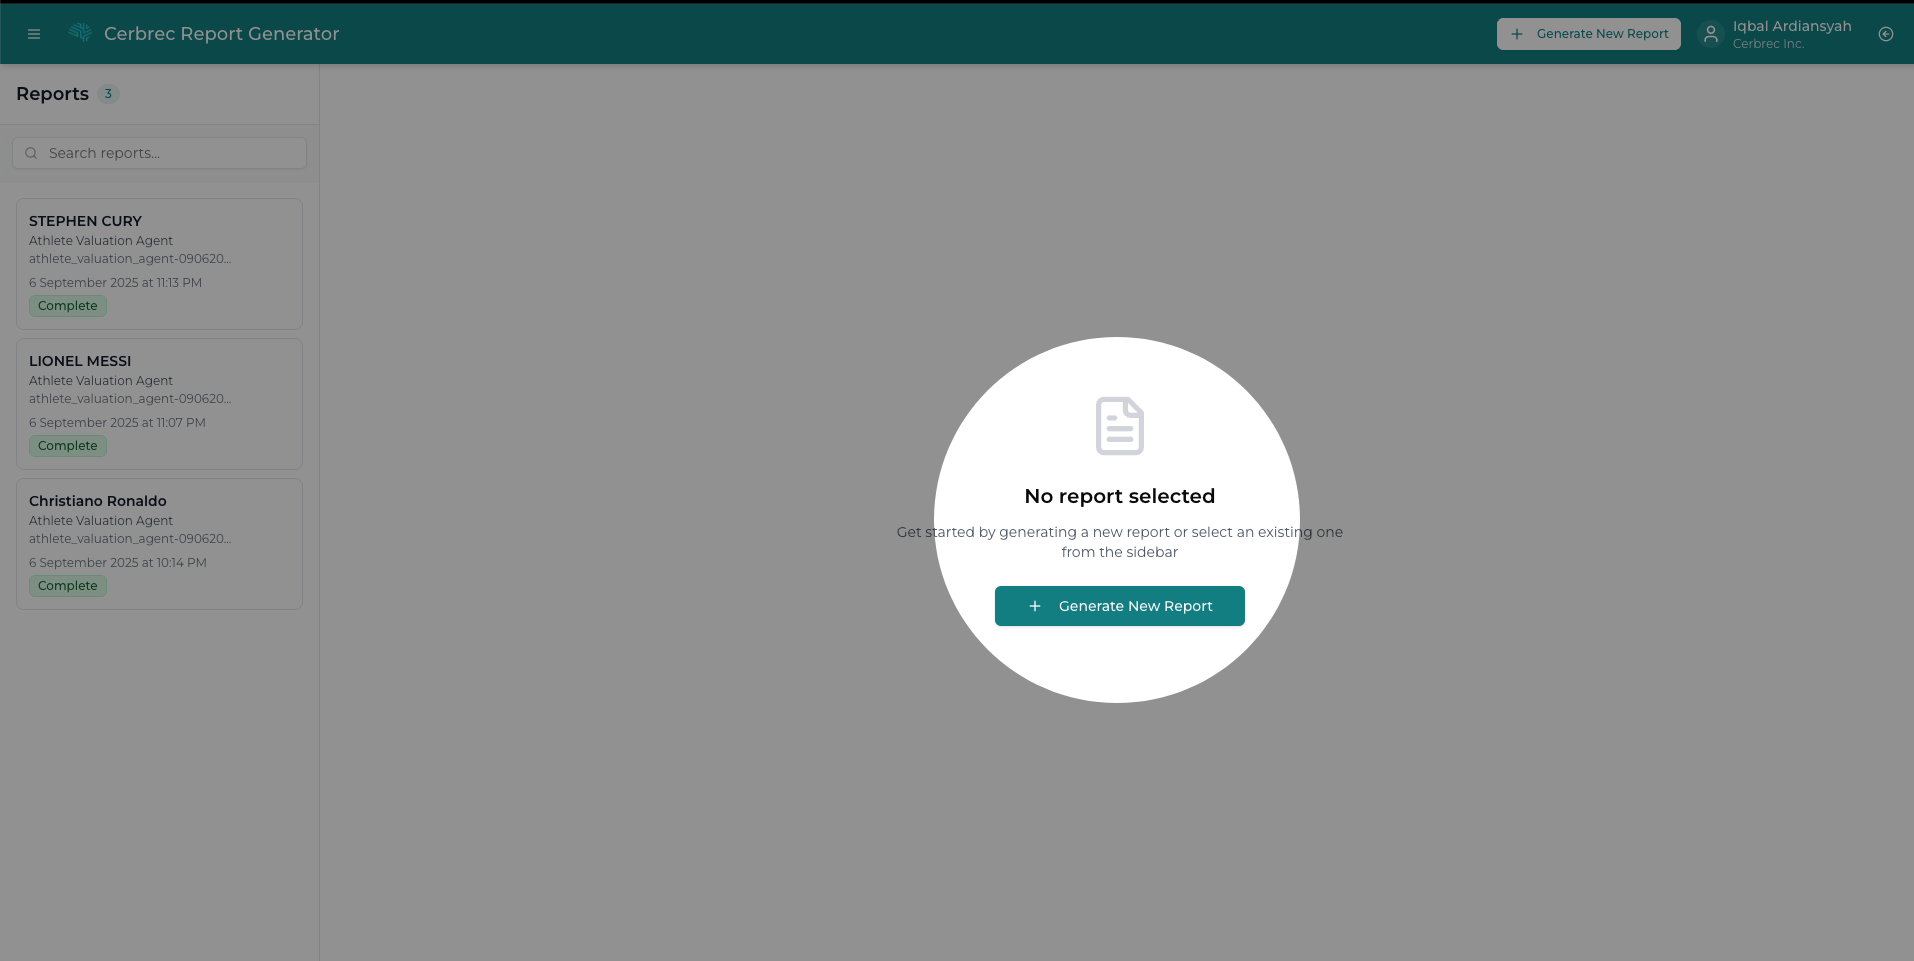
Clicking on any report from the list will bring it into the main view where you can interact with it.
Creating New Reports
To create a new report from scratch, use the Generate Report button at the top of the interface.
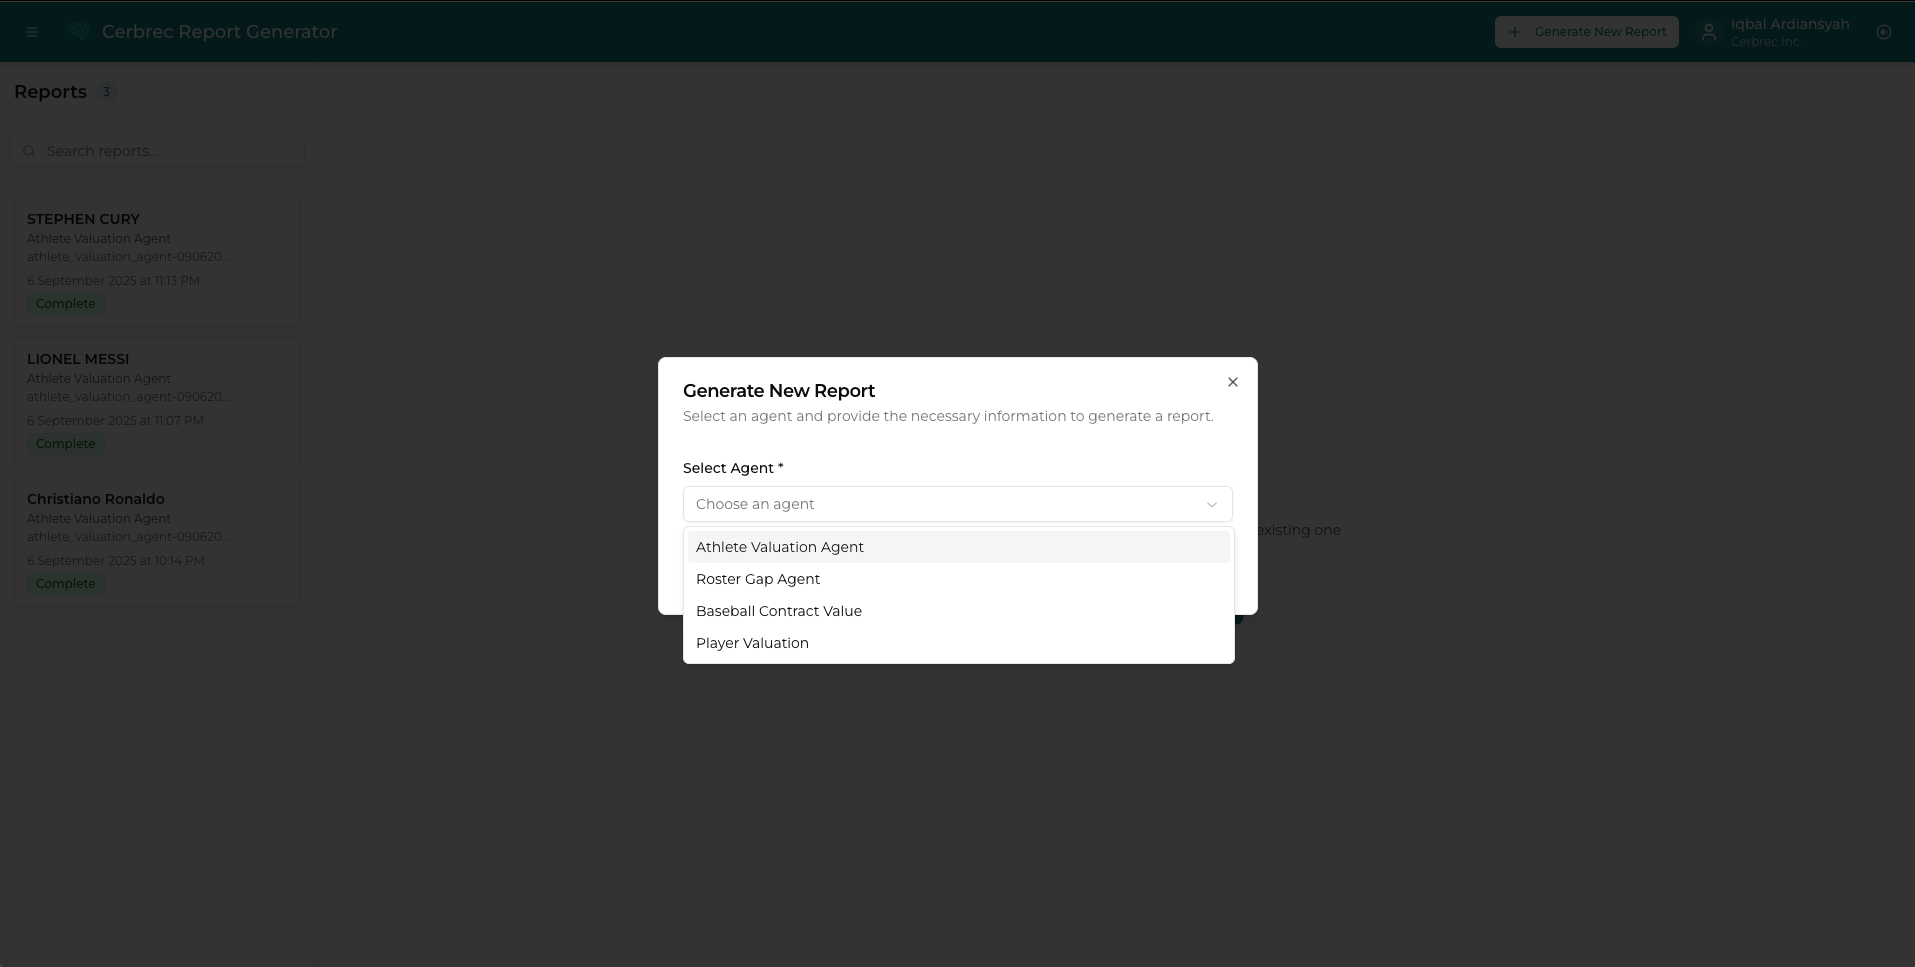
Agent Selection
Clicking Generate Report opens a dialog where you can select which type of AI agent to use for generating your report. Different agents are specialized for different types of analysis and reporting needs.
Report Generation Process
- Select Template: Choose from available AI agents/templates
- Enter Prompt: Provide specific instructions for your report
- Add Parameters: Fill in any additional fields that appear
- Generate: Click "Generate Report" to start the process
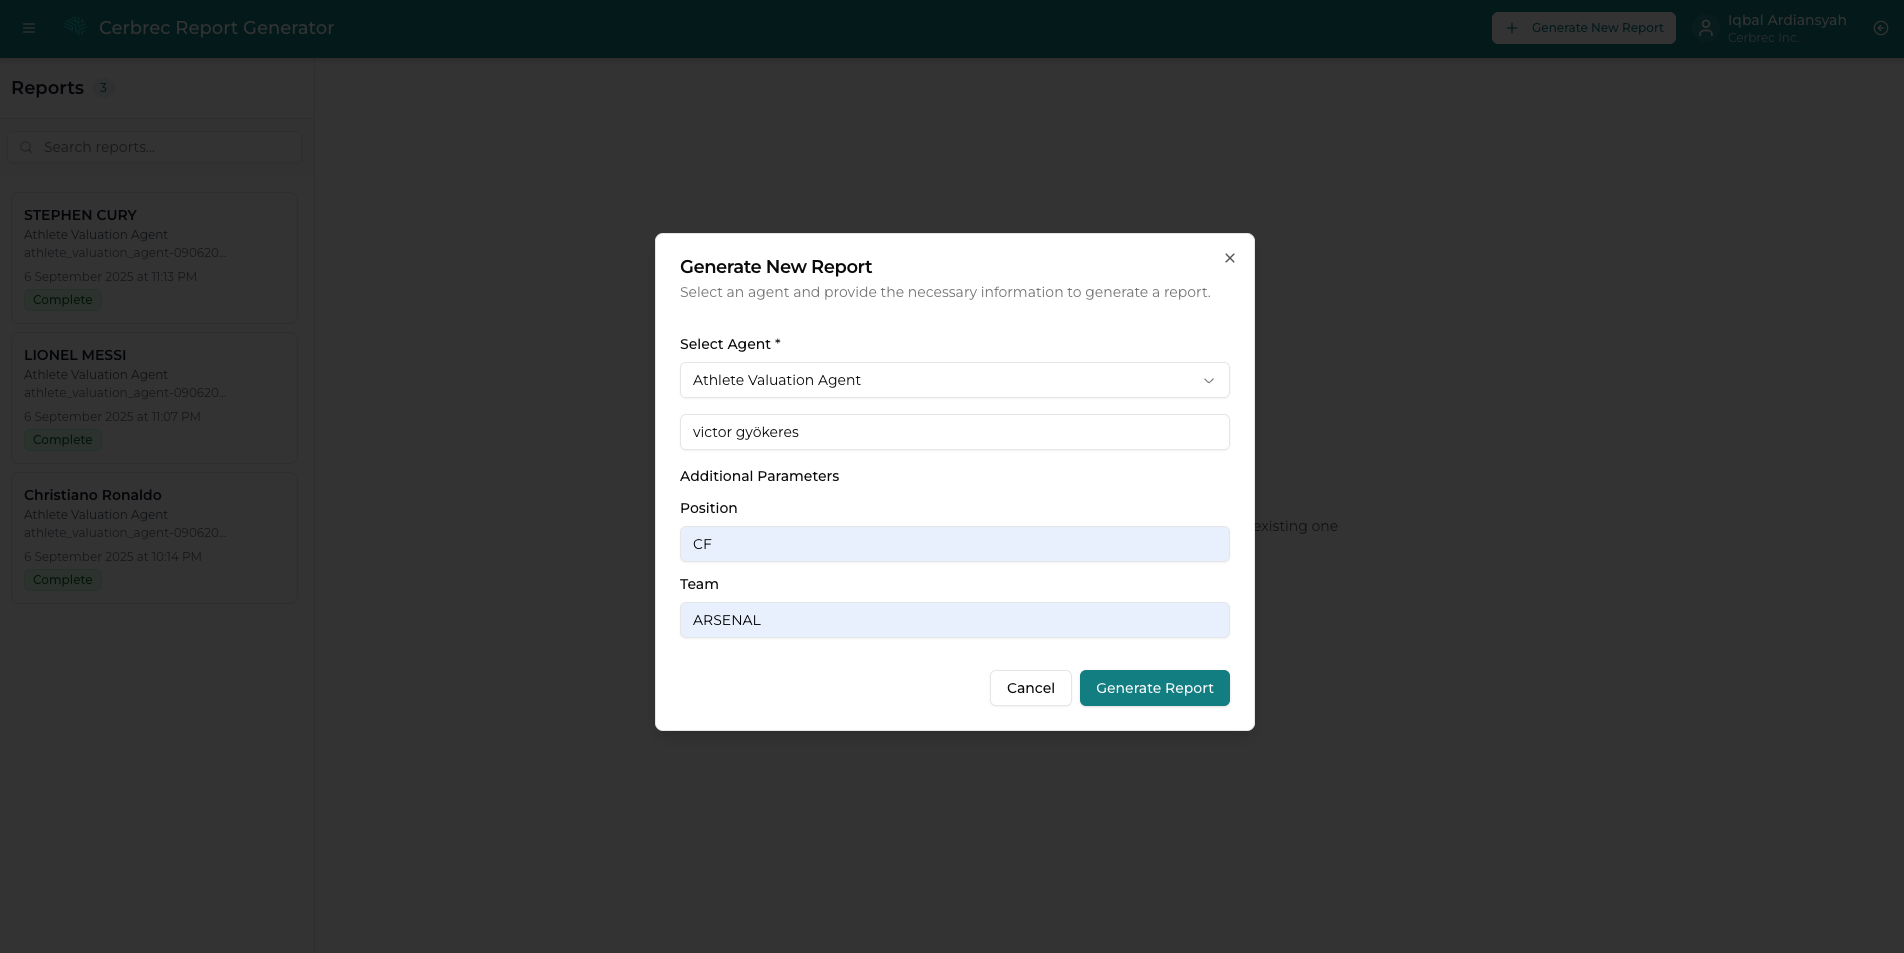
After selecting your preferred agent and providing the necessary information, click Generate Report. The system will begin creating a new report using the selected AI agent's capabilities.
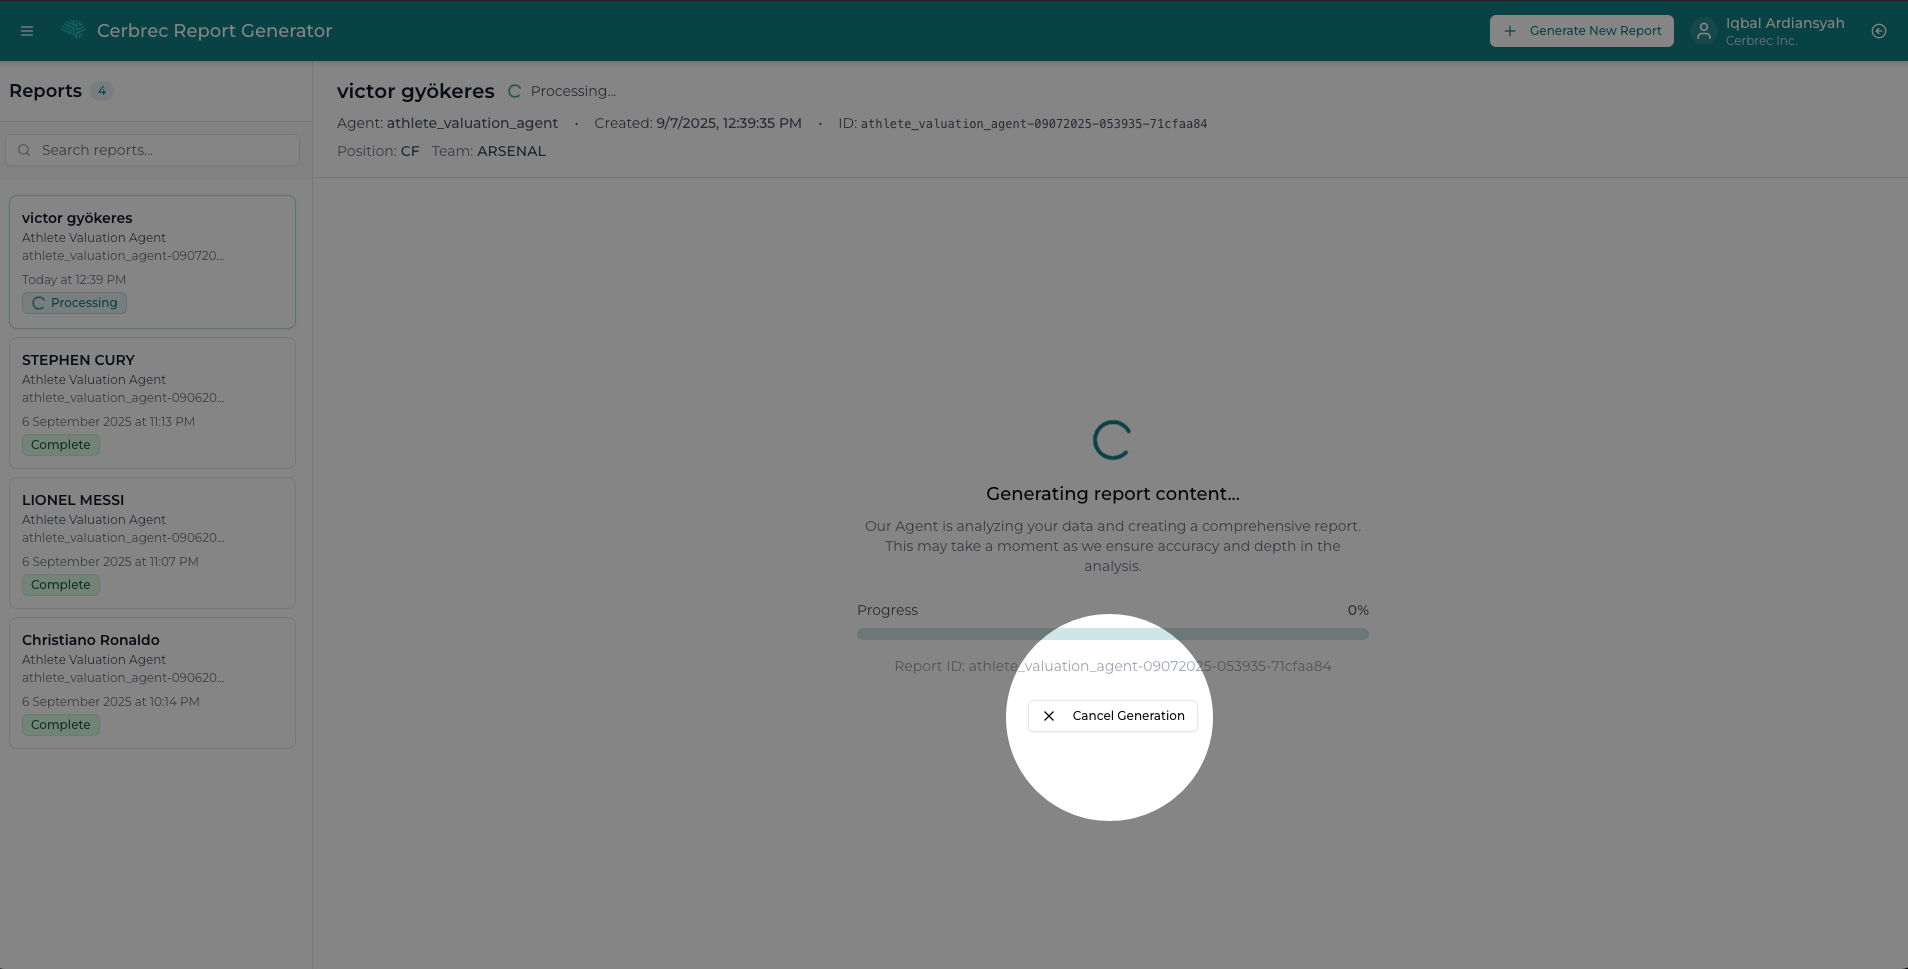
Canceling Report Generation
While a report is being generated, you can cancel the process if needed:
- Monitor Progress: View the progress bar and percentage completion
- Cancel Option: Click the "Cancel Generation" button that appears during processing
- Confirmation: The report generation will stop and the report status will change to "Cancelled"
This feature is useful if:
- You realize you need to modify the prompt or parameters
- The generation is taking longer than expected
- You want to free up resources for other reports
Report Management
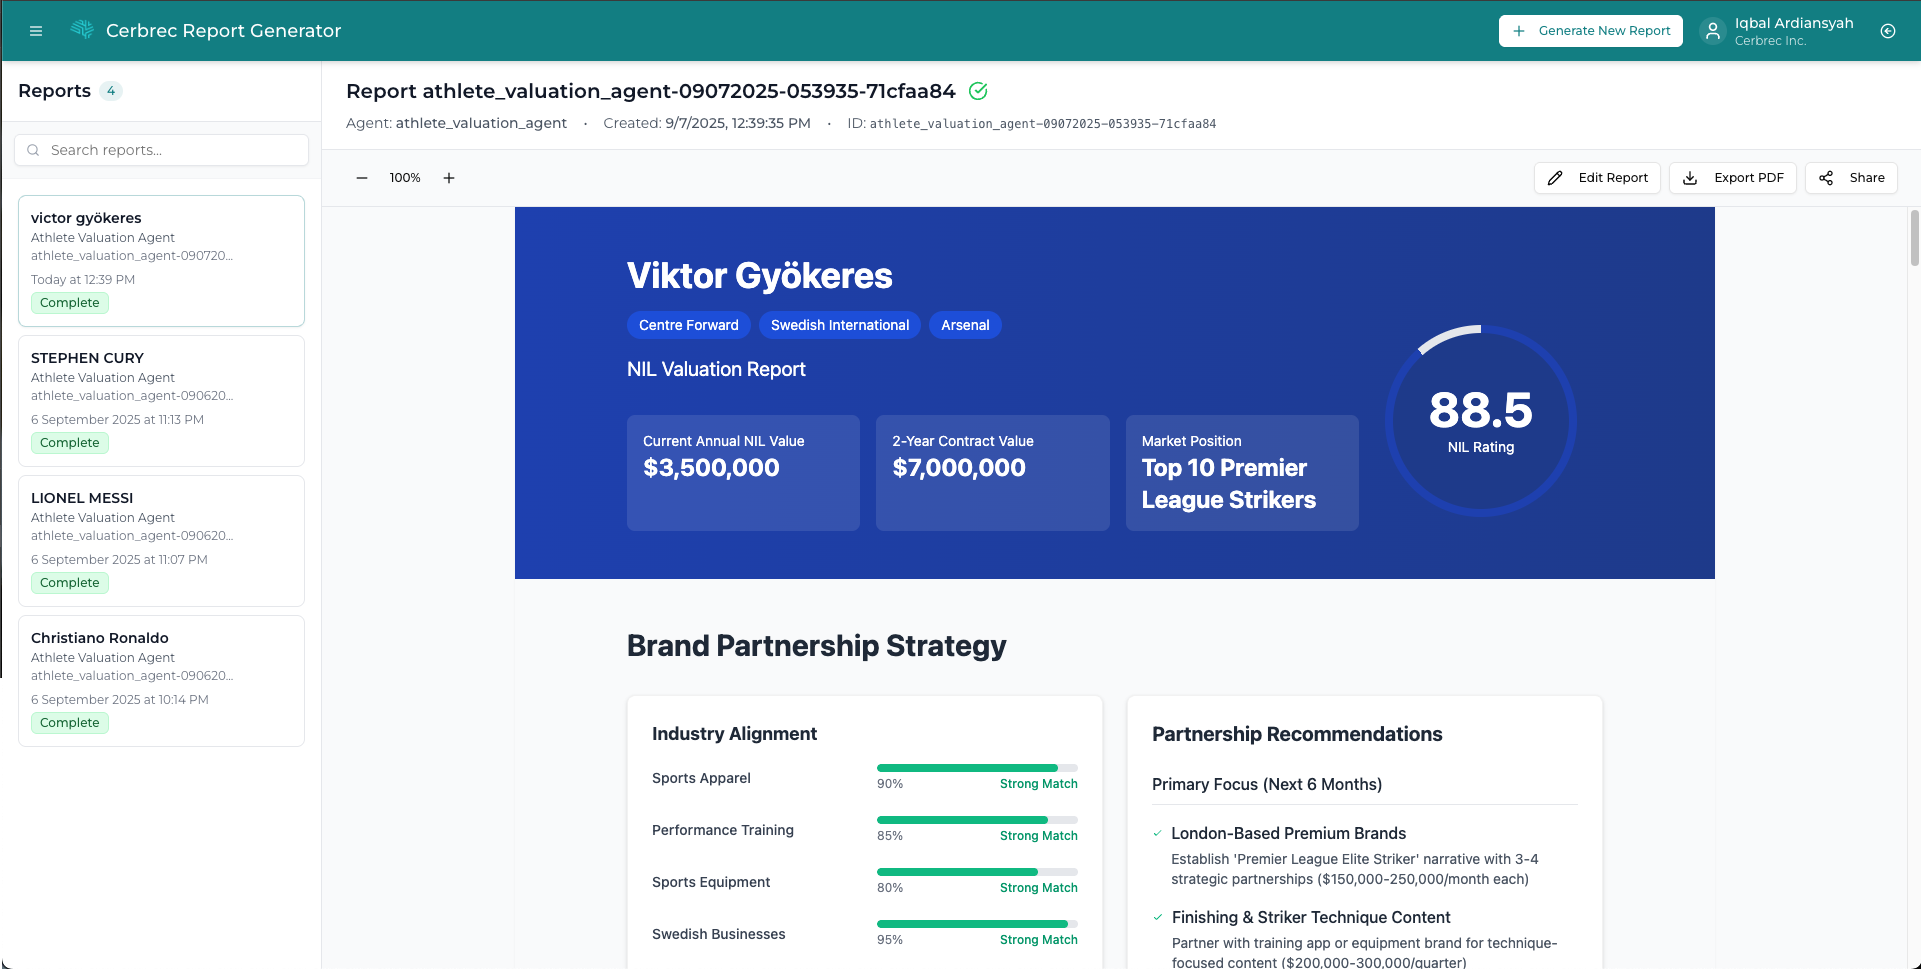
Viewing and Exporting Reports
Once you select a report from the dashboard, you'll see the report content in the main viewing area. From this view, you have several primary actions available:
- Edit Report: Opens the report in edit mode for customization and modifications
- Export PDF: Generates a PDF version of the report and downloads it to your downloads folder
- Share: Creates a shareable link for others to view the report
Report Actions
For Completed Reports:
- View: Display full report content
- Edit: Launch Report Editor for detailed customization
- Share: Generate view-only links for collaboration
- Export PDF: Download professional PDF version
- Delete: Remove unwanted reports
For In-Progress Reports:
- Cancel: Stop generation and free up resources
- Monitor: View real-time progress updates
Search and Organization
The sidebar includes:
- Search Bar: Filter reports by name or content
- Pagination: Navigate through multiple pages of reports
- Status Filtering: View reports by their current status
Report Editor
When you select Edit Report, the report opens in an interactive edit mode. In this mode, all text content becomes editable, and you gain access to powerful AI-powered editing capabilities.
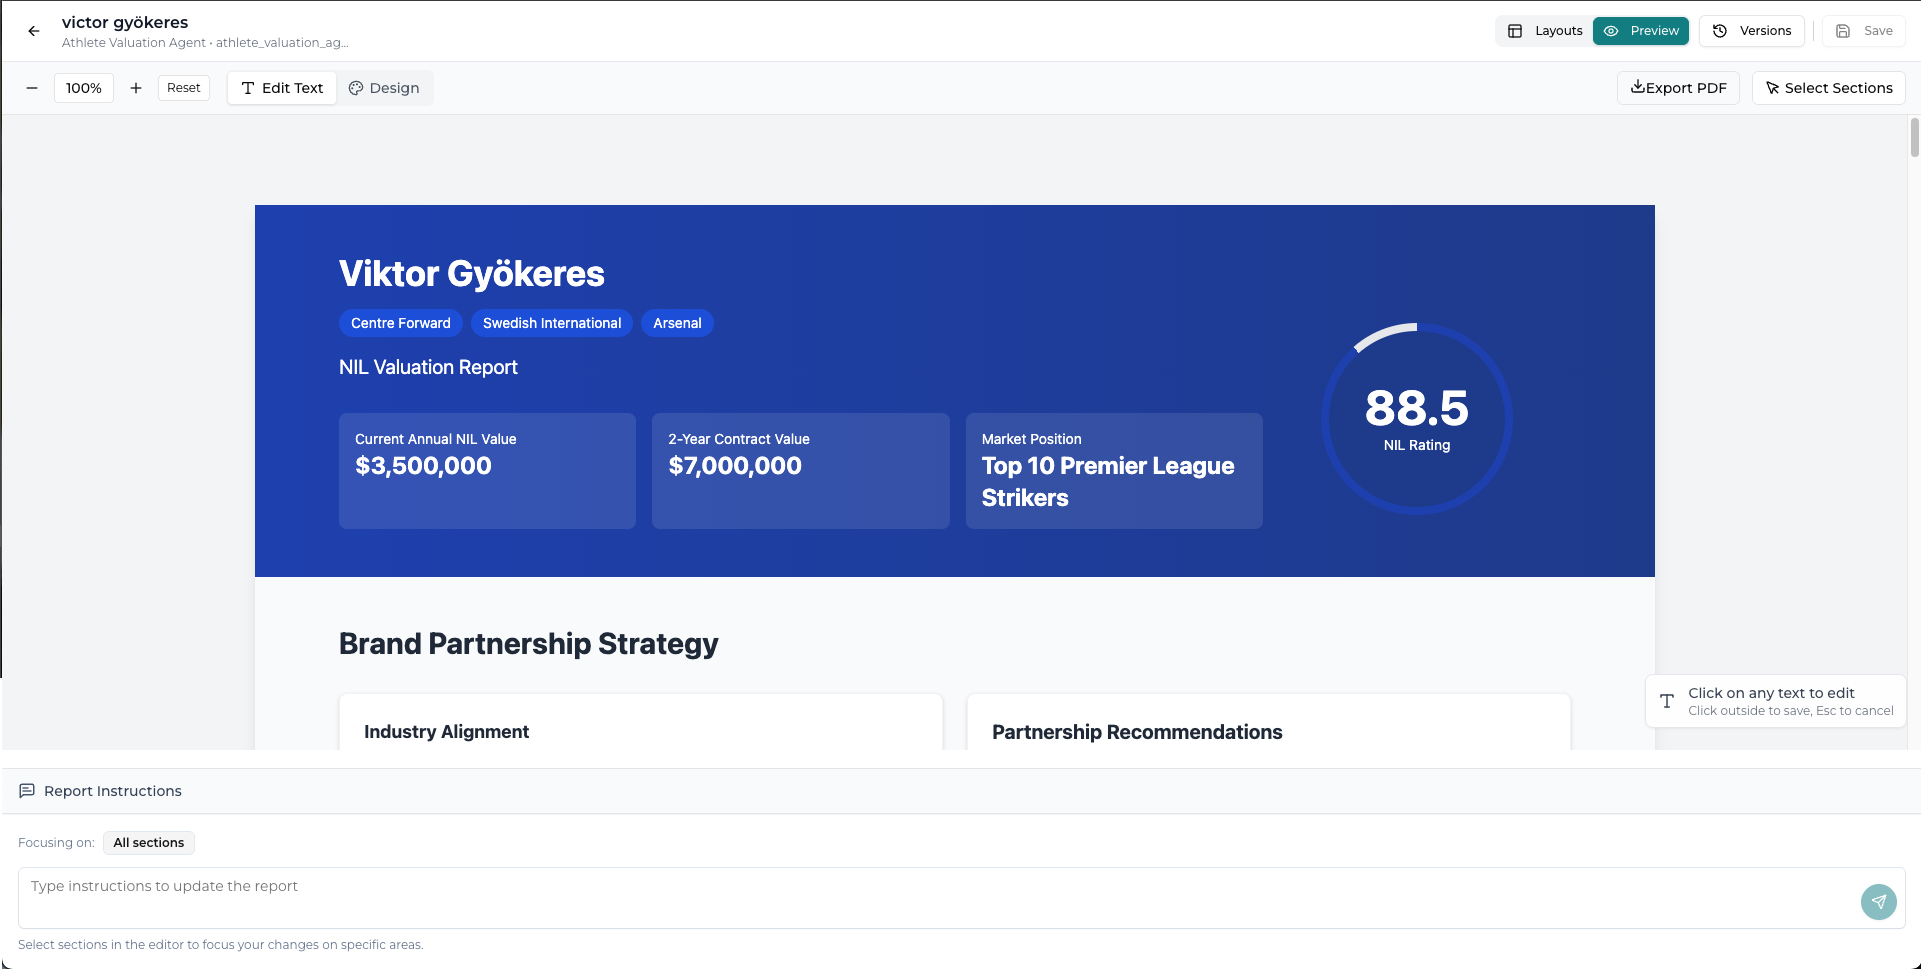
The edit mode features:
- Live Preview: Real-time display of report content
- Direct Editing: Click on any text to edit inline
- AI Prompts: Use natural language to modify content
- Design Tools: Access to styling and layout options
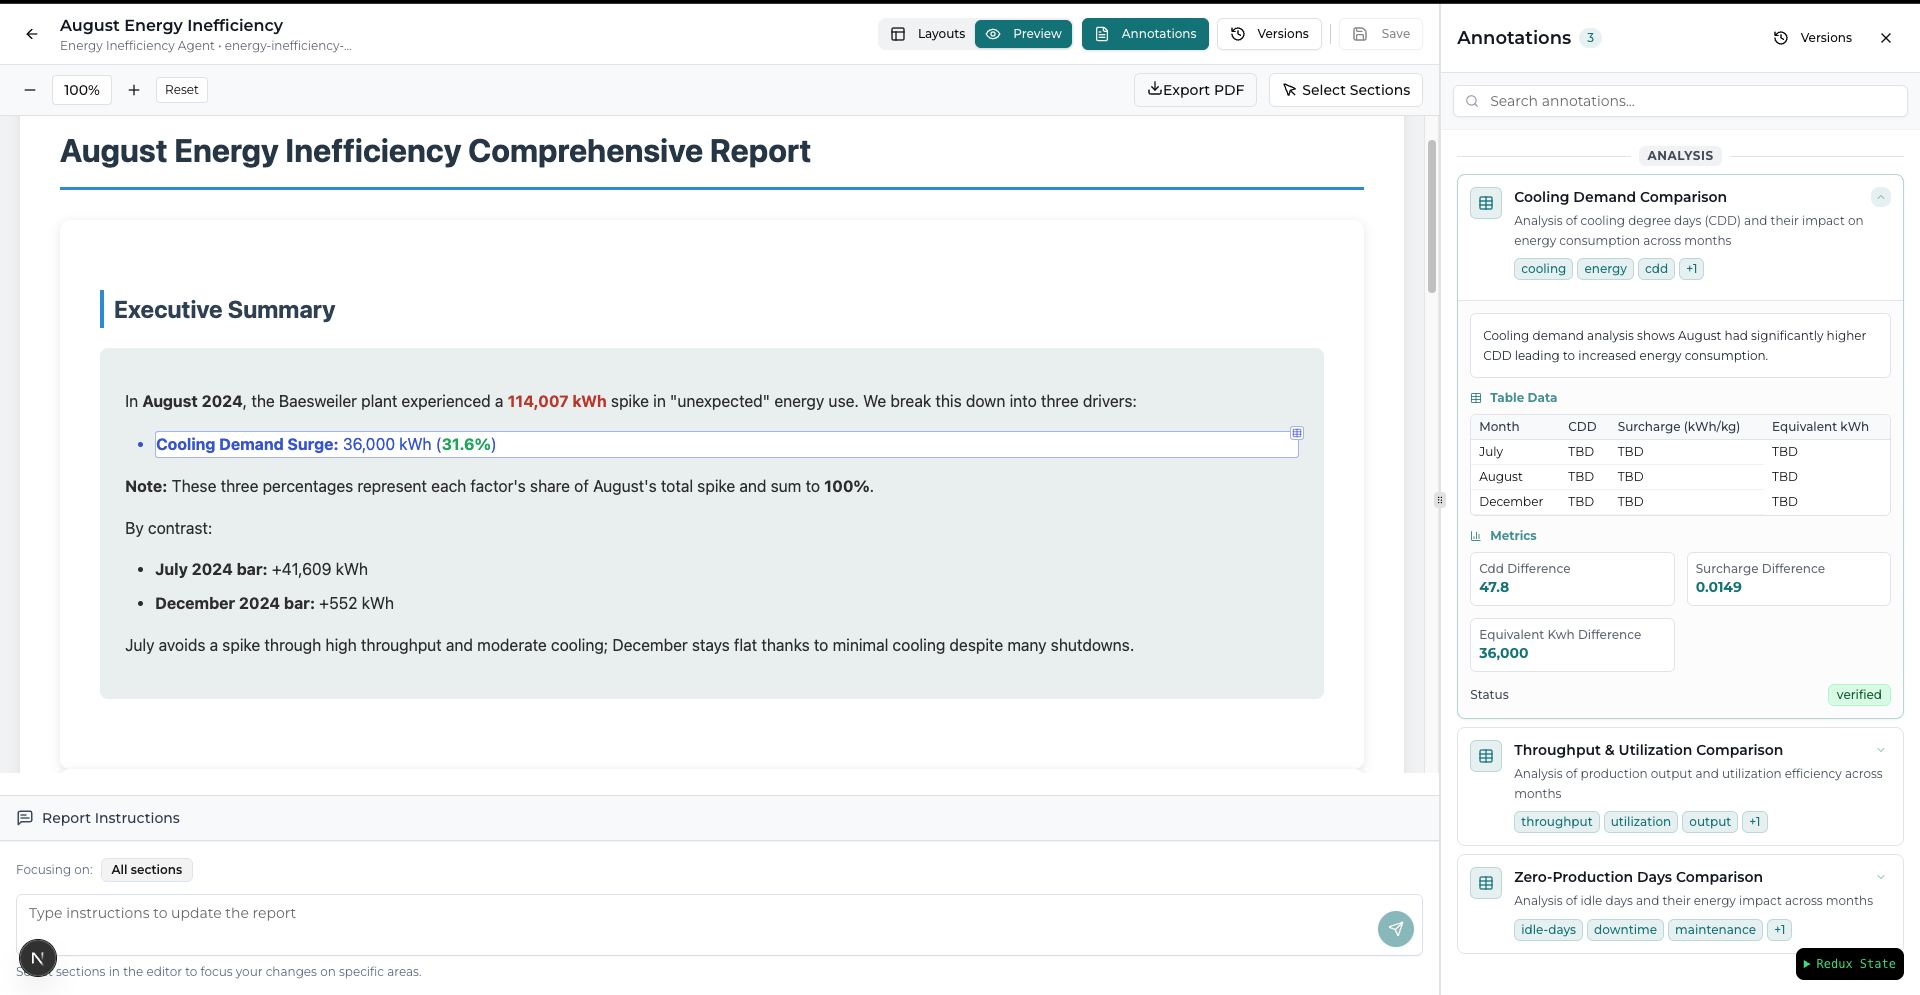
Three-Panel Layout
The Report Editor uses an intuitive three-panel layout:
- Left Panel - Sections: Hierarchical list of all report sections
- Center Panel - Preview: Live preview with direct editing capabilities
- Right Panel - Tools: Design panel, annotations, and version history
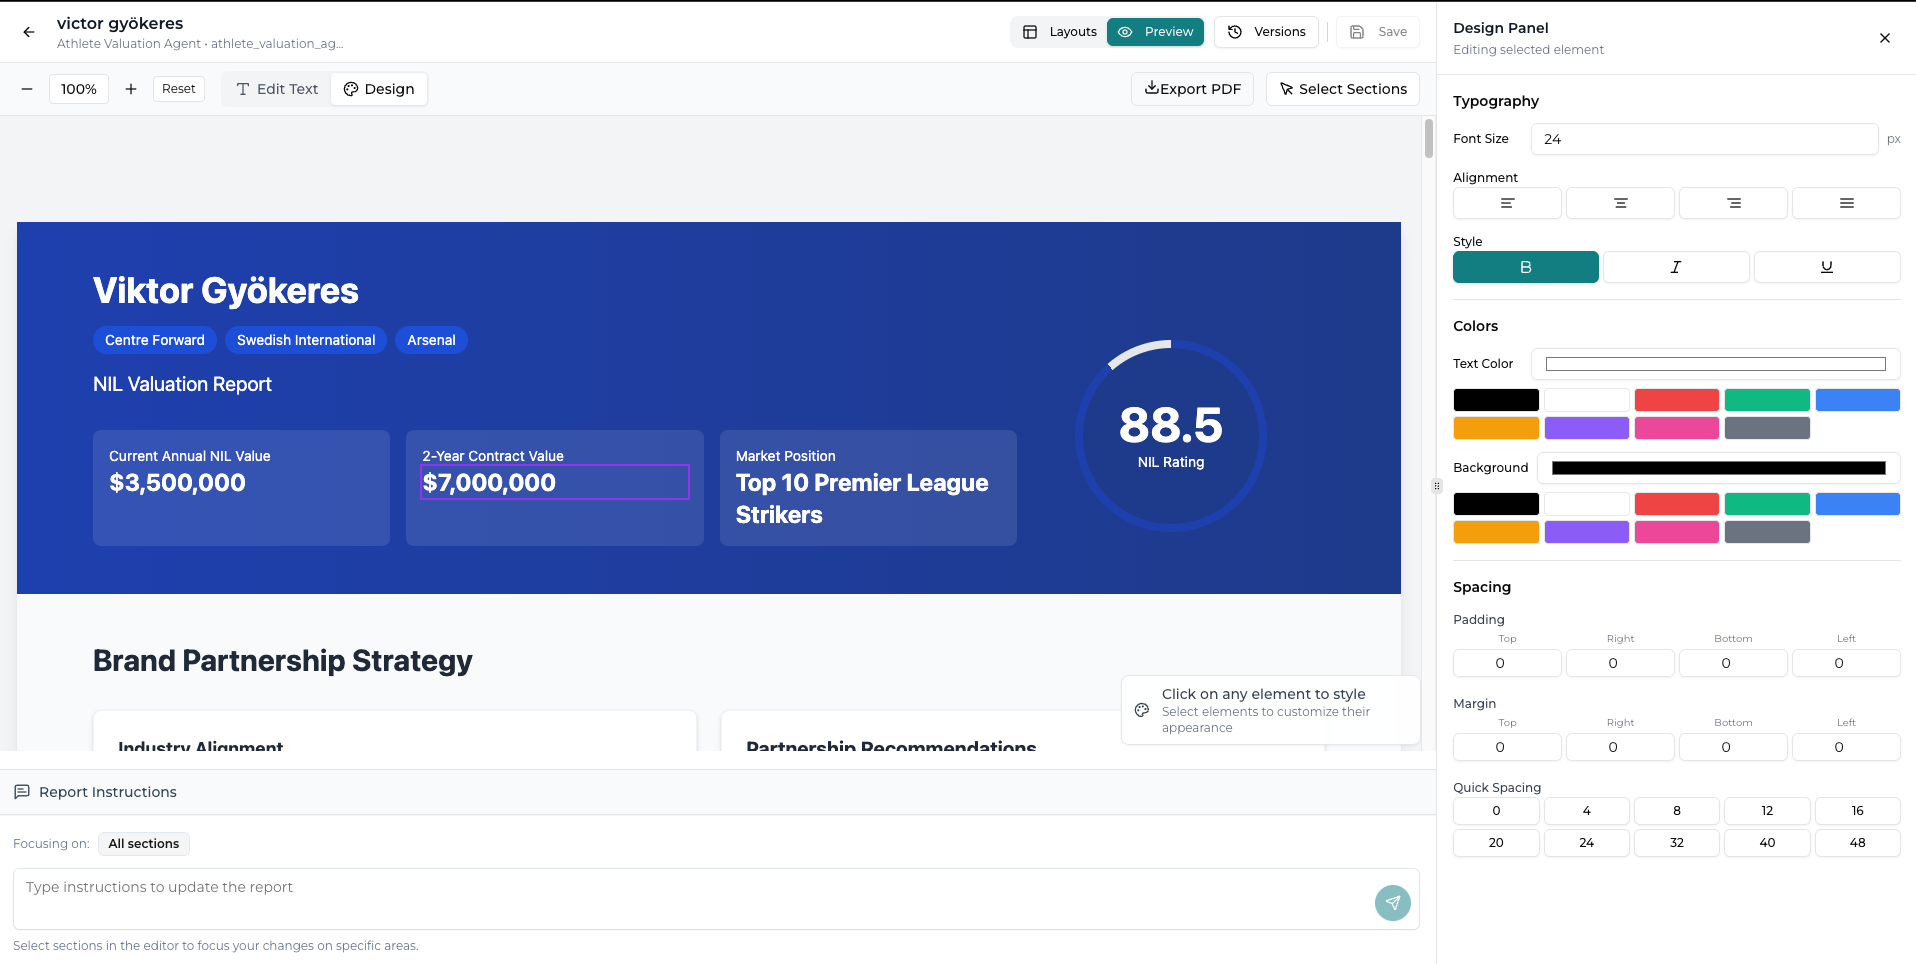
Design Panel
The Design Panel provides comprehensive styling controls for customizing the visual appearance of your reports. This powerful feature allows you to create professional, branded documents that match your organization's style.
Accessing the Design Panel
- Open Design Tools: Click the palette icon in the toolbar or the "Design" button
- Select Elements: Click any element in the preview to select it for styling
- Apply Changes: Use the controls in the design panel to modify appearance
Typography Controls
The typography section allows you to control text appearance:
Font Size
- Numeric input field (0-86px)
- Real-time preview updates
- Quick preset buttons for common sizes
Text Styles
- Bold: Toggle font weight for emphasis
- Italic: Add slanted text styling
- Underline: Add underline decoration
Text Alignment
- Left align for standard text
- Center align for headings and titles
- Right align for specialized content
- Justify for formal document formatting
Color Controls
Customize colors throughout your report:
Text Color
- Color picker interface with visual preview
- Hex value input for precise colors
- Preset color swatches for quick selection
- Recent colors automatically saved
Background Color
- Same controls as text color
- Transparency support
- Clear option to remove backgrounds
Spacing Controls
Control the space around and within elements:
Padding (Internal Spacing)
- Uniform control for all sides
- Individual side adjustments (top, right, bottom, left)
- Quick presets: 0, 4px, 8px, 16px, 24px, 32px
- Visual feedback showing changes
Margin (External Spacing)
- Same controls as padding
- Negative values supported for overlapping effects
- Auto-centering options
Applying Design Changes
- Real-time Preview: Changes appear immediately as you adjust controls
- Reset Options: Undo styling to return to defaults
- Consistent Application: Apply similar styles across multiple elements
- Save Changes: Create new versions to preserve design updates
Section Selection for Targeted Editing
If you want to limit your edits to specific sections rather than the entire report, you can use section selection. This feature allows you to target your prompts to particular areas of the report.
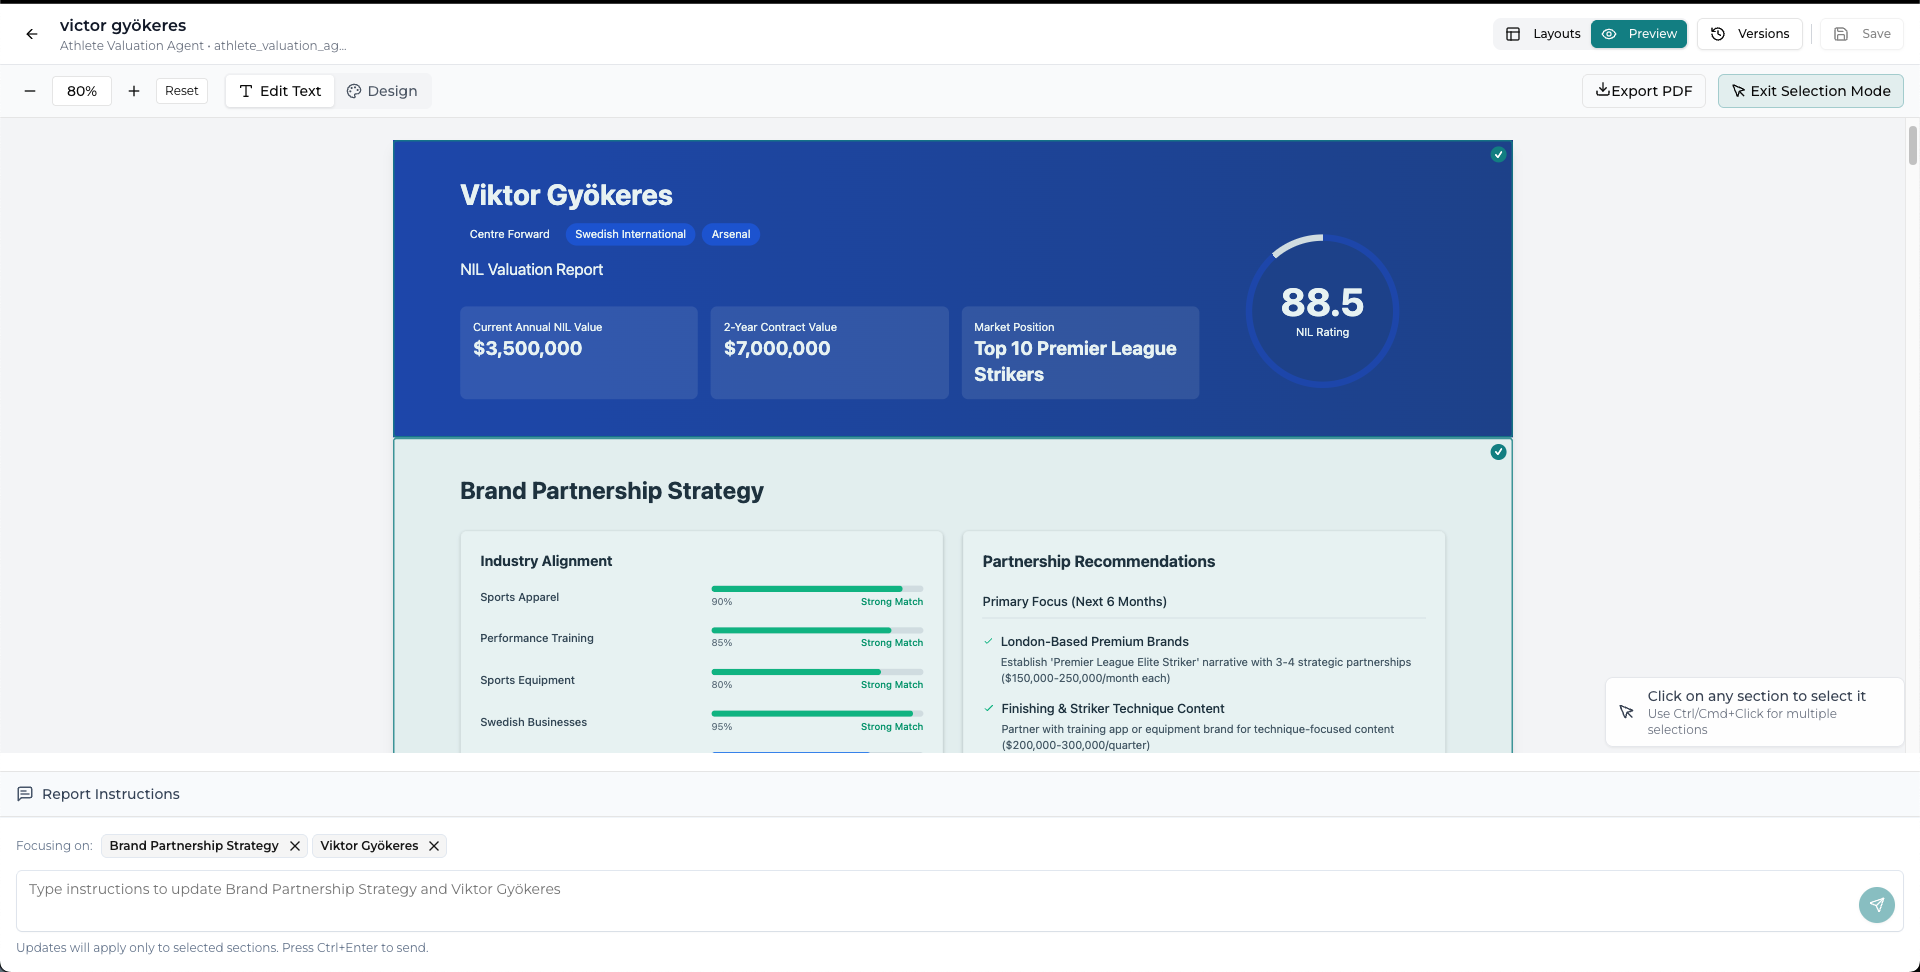
When sections are selected (for example, Performance Focused Strategy and Brand Partnership Strategy), any prompts you provide will only edit those specific sections, giving you precise control over your modifications.
Version History
On the right-hand side of the edit interface, you can access the version history of your report. This panel shows all previous versions of the report, allowing you to track changes over time and revert to earlier versions if needed.
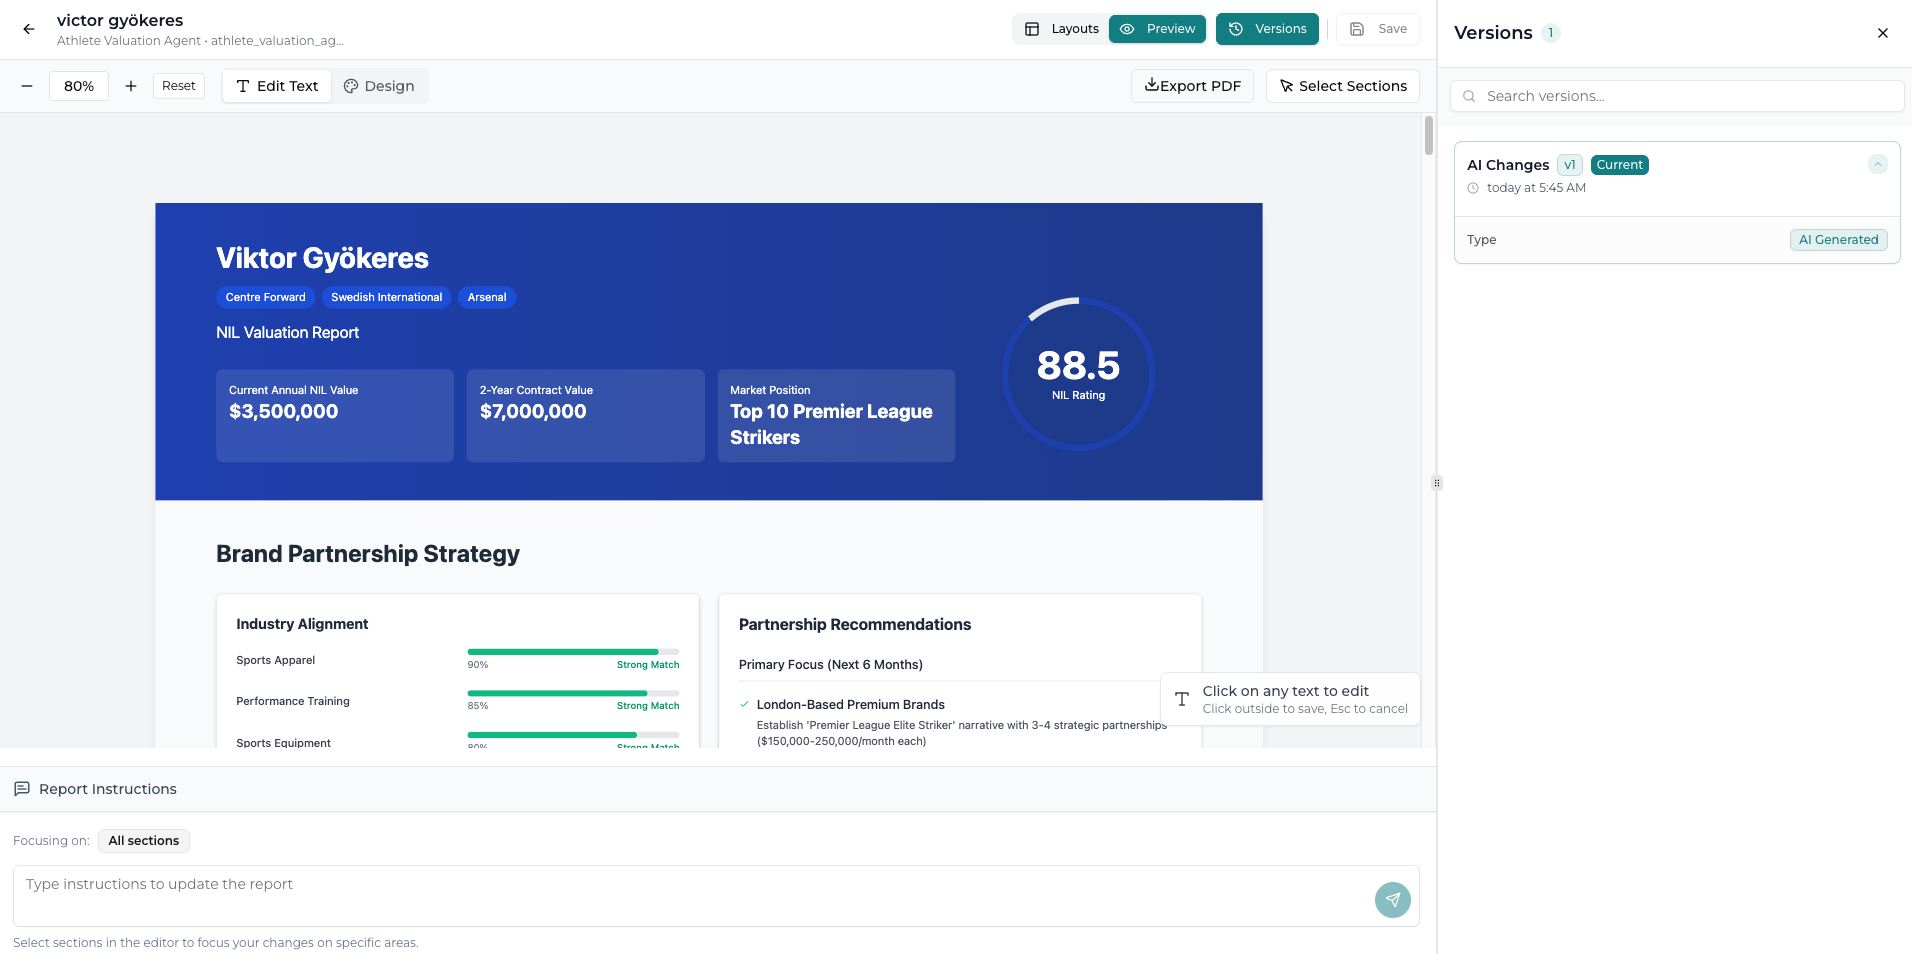
Version Control Features
- Save Versions: Create snapshots of your work at key milestones
- Compare Versions: View differences between different versions
- Restore Previous: Return to earlier versions when needed
- Version Names: Add descriptive labels to track purposes
You can upload and restore previous versions as needed, ensuring you never lose important iterations of your work.
Advanced Features
Layout Editor
The Layouts button opens a comprehensive layout editor for your entire report. This drag-and-drop interface allows you to reorganize sections, change the order of content, and customize the overall structure of your report.
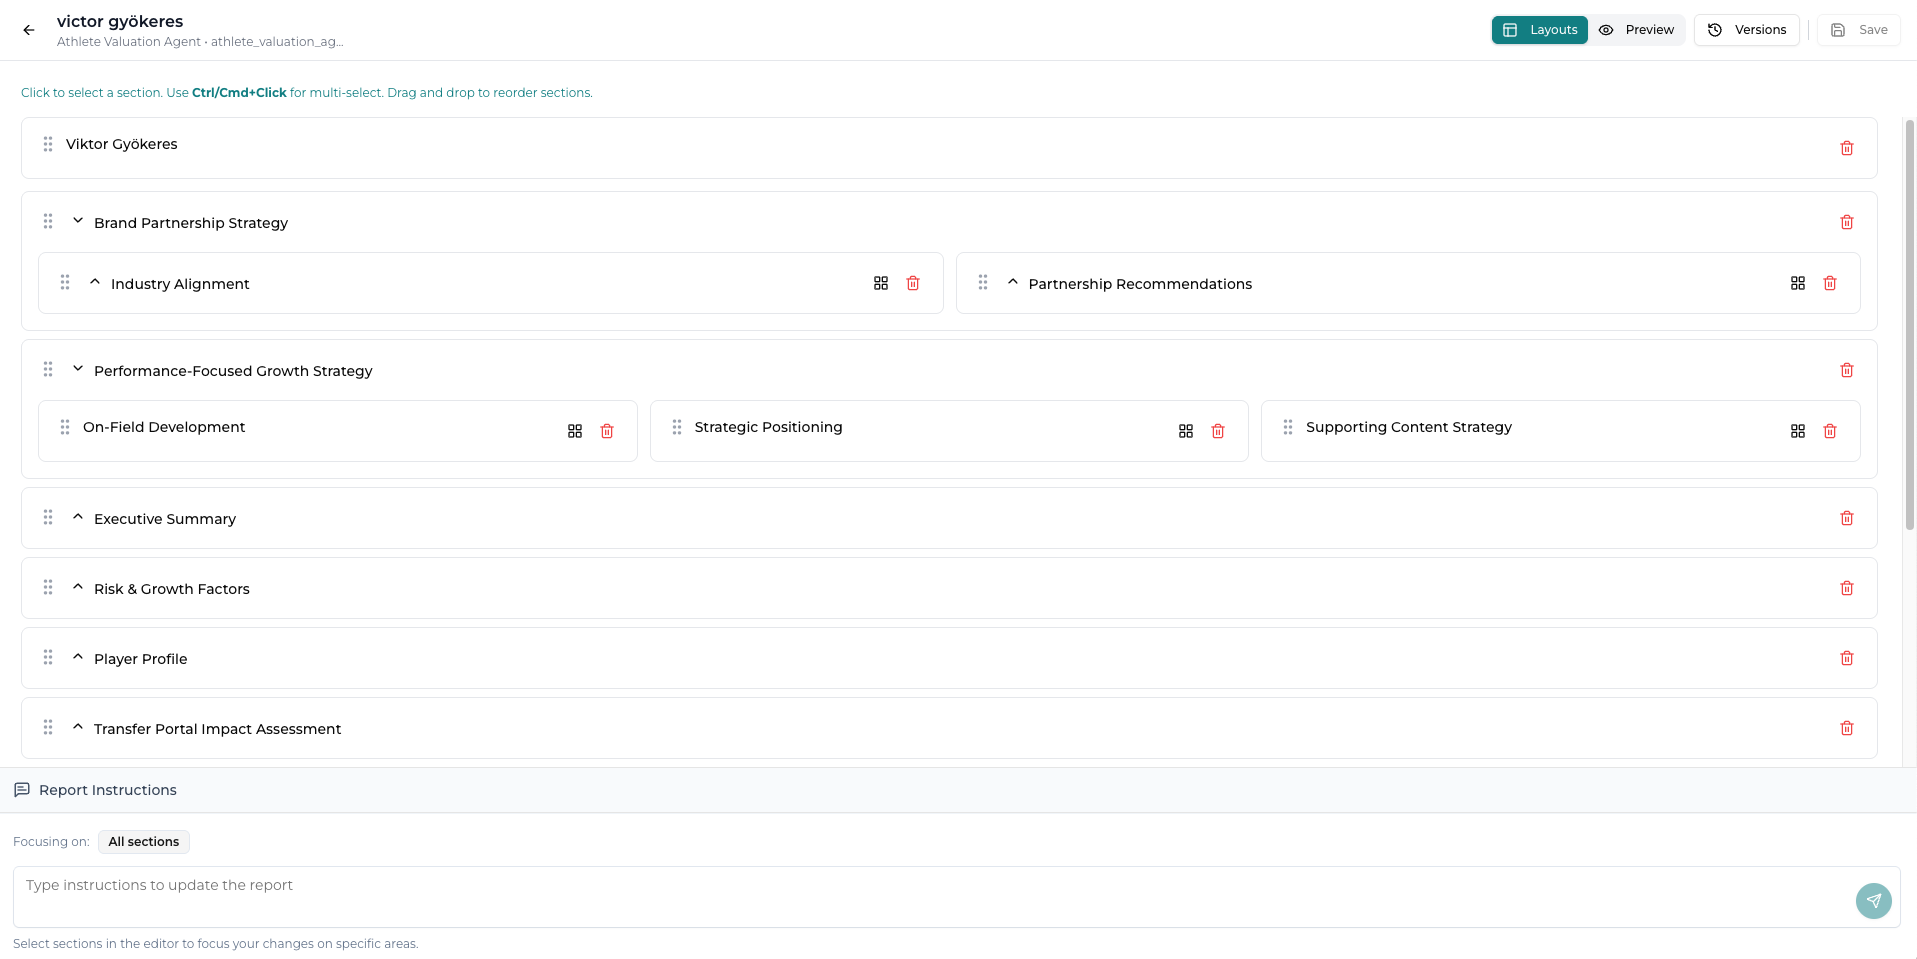
Layout Editing Features:
- Drag sections to reorder them (e.g., move Executive Summary to the top)
- Modify the layout and formatting of individual sections
- Preview changes before applying them
- Save changes to create a new version with the updated layout
After making your layout changes, you can preview the modifications and select Save when you're ready to create a new version of the report with the updated structure.
AI-Powered Prompt Editing
The edit mode features a prompt area at the bottom of the screen. When you enter a prompt, it will apply edits to all sections of the report by default. This allows you to make comprehensive changes across the entire document using natural language instructions.
Example Prompts:
- "Make the tone more formal and professional"
- "Add bullet points to the key findings section"
- "Expand the conclusion with actionable recommendations"
- "Summarize the executive summary to be more concise"
Export and Sharing Options
PDF Export
- Professional formatting preserved
- Download directly to your device
- Print-ready output
Share Links
- Generate view-only URLs
- No login required for recipients
- Persistent links that remain active
Keyboard Shortcuts
Speed up your workflow with these shortcuts:
- Click to Edit: Direct inline editing of any text
- Drag to Reorder: Move sections by dragging handles
- ESC: Close dialogs and panels
Upcoming Features
Several powerful features are coming soon to enhance the report generation capabilities:
- Report-to-Agent Conversion: Convert any report version you create into a new custom agent for future use
- Custom Template Bootstrap: Create your own report templates and convert them into specialized agents
- Enhanced Agent Capabilities: More comprehensive features leveraging Graphbook's powerful tensor infrastructure
- Annotation Reasoning: Advanced analysis breakdown showing the reasoning behind report generation
Best Practices
Report Generation Tips
- Choose agents that match your analysis needs
- Provide clear, specific prompts with context
- Include all relevant parameters for better results
- Use descriptive names when saving versions
Design and Styling Guidelines
- Maintain consistent fonts and colors throughout
- Use spacing effectively to improve readability
- Apply styling systematically across similar elements
- Preview your changes before finalizing
Collaboration Workflow
- Save versions before major changes
- Use descriptive version names
- Share view-only links for feedback
- Document changes in version descriptions
Troubleshooting
Generation Issues:
- If generation takes too long, try using the cancel button and retry with a simpler prompt
- Check that all required parameters are filled correctly
- Verify your network connection is stable
Editing Problems:
- If changes don't appear, try refreshing the preview
- Save your work as a new version if experiencing issues
- Clear your browser cache if the interface becomes unresponsive
Export Problems:
- Ensure your browser allows downloads
- Contact support if exports consistently fail